Differential Gene Expression Analysis
Last updated: 2025-06-11
Checks: 6 1
Knit directory: CX5461_Project/
This reproducible R Markdown analysis was created with workflowr (version 1.7.1). The Checks tab describes the reproducibility checks that were applied when the results were created. The Past versions tab lists the development history.
The R Markdown file has unstaged changes. To know which version of
the R Markdown file created these results, you’ll want to first commit
it to the Git repo. If you’re still working on the analysis, you can
ignore this warning. When you’re finished, you can run
wflow_publish to commit the R Markdown file and build the
HTML.
Great job! The global environment was empty. Objects defined in the global environment can affect the analysis in your R Markdown file in unknown ways. For reproduciblity it’s best to always run the code in an empty environment.
The command set.seed(20250129) was run prior to running
the code in the R Markdown file. Setting a seed ensures that any results
that rely on randomness, e.g. subsampling or permutations, are
reproducible.
Great job! Recording the operating system, R version, and package versions is critical for reproducibility.
Nice! There were no cached chunks for this analysis, so you can be confident that you successfully produced the results during this run.
Great job! Using relative paths to the files within your workflowr project makes it easier to run your code on other machines.
Great! You are using Git for version control. Tracking code development and connecting the code version to the results is critical for reproducibility.
The results in this page were generated with repository version 570ce4f. See the Past versions tab to see a history of the changes made to the R Markdown and HTML files.
Note that you need to be careful to ensure that all relevant files for
the analysis have been committed to Git prior to generating the results
(you can use wflow_publish or
wflow_git_commit). workflowr only checks the R Markdown
file, but you know if there are other scripts or data files that it
depends on. Below is the status of the Git repository when the results
were generated:
Ignored files:
    Ignored:    .RData
    Ignored:    .Rhistory
    Ignored:    .Rproj.user/
    Ignored:    0.1 box.svg
    Ignored:    Rplot04.svg

Untracked files:
    Untracked:  0.1 density.svg
    Untracked:  0.1.emf
    Untracked:  0.1.svg
    Untracked:  0.5 box.svg
    Untracked:  0.5 density.svg
    Untracked:  0.5.svg
    Untracked:  Additional/
    Untracked:  Autosome factors.svg
    Untracked:  CX_5461_Pattern_Genes_24hr.csv
    Untracked:  CX_5461_Pattern_Genes_3hr.csv
    Untracked:  Cell viability box plot.svg
    Untracked:  DEG GO terms.svg
    Untracked:  DNA damage associated GO terms.svg
    Untracked:  DRC1.svg
    Untracked:  Figure 1.jpeg
    Untracked:  Figure 1.pdf
    Untracked:  Figure_CM_Purity.pdf
    Untracked:  G Quadruplex DEGs.svg
    Untracked:  PC2 Vs PC3 Autosome.svg
    Untracked:  PCA autosome.svg
    Untracked:  Rplot 18.svg
    Untracked:  Rplot.svg
    Untracked:  Rplot01.svg
    Untracked:  Rplot02.svg
    Untracked:  Rplot03.svg
    Untracked:  Rplot05.svg
    Untracked:  Rplot06.svg
    Untracked:  Rplot07.svg
    Untracked:  Rplot08.jpeg
    Untracked:  Rplot08.svg
    Untracked:  Rplot09.svg
    Untracked:  Rplot10.svg
    Untracked:  Rplot11.svg
    Untracked:  Rplot12.svg
    Untracked:  Rplot13.svg
    Untracked:  Rplot14.svg
    Untracked:  Rplot15.svg
    Untracked:  Rplot16.svg
    Untracked:  Rplot17.svg
    Untracked:  Rplot18.svg
    Untracked:  Rplot19.svg
    Untracked:  Rplot20.svg
    Untracked:  Rplot21.svg
    Untracked:  Rplot22.svg
    Untracked:  Rplot23.svg
    Untracked:  Rplot24.svg
    Untracked:  TOP2B.bed
    Untracked:  TS HPA (Violin).svg
    Untracked:  TS HPA.svg
    Untracked:  TS_HA.svg
    Untracked:  TS_HV.svg
    Untracked:  Violin HA.svg
    Untracked:  Violin HV (CX vs DOX).svg
    Untracked:  Violin HV.svg
    Untracked:  data/AF.csv
    Untracked:  data/AF_Mapped.csv
    Untracked:  data/AF_genes.csv
    Untracked:  data/Annotated_DOX_Gene_Table.csv
    Untracked:  data/BP/
    Untracked:  data/CAD_genes.csv
    Untracked:  data/Cardiotox.csv
    Untracked:  data/Cardiotox_mapped.csv
    Untracked:  data/Col_DEG_proportion_data.csv
    Untracked:  data/Col_DEGs.csv
    Untracked:  data/Corrmotif_GO/
    Untracked:  data/DOX_Vald.csv
    Untracked:  data/DOX_Vald_Mapped.csv
    Untracked:  data/DOX_alt.csv
    Untracked:  data/Entrez_Cardiotox.csv
    Untracked:  data/Entrez_Cardiotox_Mapped.csv
    Untracked:  data/GWAS.xlsx
    Untracked:  data/GWAS_SNPs.bed
    Untracked:  data/HF.csv
    Untracked:  data/HF_Mapped.csv
    Untracked:  data/HF_genes.csv
    Untracked:  data/Hypertension_genes.csv
    Untracked:  data/MI_genes.csv
    Untracked:  data/P53_Target_mapped.csv
    Untracked:  data/Sample_annotated.csv
    Untracked:  data/Samples.csv
    Untracked:  data/Samples.xlsx
    Untracked:  data/TOP2A.bed
    Untracked:  data/TOP2A_target.csv
    Untracked:  data/TOP2A_target_lit.csv
    Untracked:  data/TOP2A_target_lit_mapped.csv
    Untracked:  data/TOP2A_target_mapped.csv
    Untracked:  data/TOP2B.bed
    Untracked:  data/TOP2B_target.csv
    Untracked:  data/TOP2B_target_heatmap.csv
    Untracked:  data/TOP2B_target_heatmap_mapped.csv
    Untracked:  data/TOP2B_target_mapped.csv
    Untracked:  data/TS.csv
    Untracked:  data/TS_HPA.csv
    Untracked:  data/TS_HPA_mapped.csv
    Untracked:  data/Toptable_CX_0.1_24.csv
    Untracked:  data/Toptable_CX_0.1_3.csv
    Untracked:  data/Toptable_CX_0.1_48.csv
    Untracked:  data/Toptable_CX_0.5_24.csv
    Untracked:  data/Toptable_CX_0.5_3.csv
    Untracked:  data/Toptable_CX_0.5_48.csv
    Untracked:  data/Toptable_DOX_0.1_24.csv
    Untracked:  data/Toptable_DOX_0.1_3.csv
    Untracked:  data/Toptable_DOX_0.1_48.csv
    Untracked:  data/Toptable_DOX_0.5_24.csv
    Untracked:  data/Toptable_DOX_0.5_3.csv
    Untracked:  data/Toptable_DOX_0.5_48.csv
    Untracked:  data/count.tsv
    Untracked:  data/heatmap.csv
    Untracked:  data/ts_data_mapped
    Untracked:  results/
    Untracked:  run_bedtools.bat

Unstaged changes:
    Deleted:    analysis/Actox.Rmd
    Modified:   analysis/DGE_Analysis.Rmd
    Modified:   data/DEGs/Toptable_DOX_0.5_3.csv
    Modified:   data/DOX_0.5_48 (Combined).csv
    Modified:   data/Human_Heart_Genes.csv
    Modified:   data/Total_number_of_Mapped_reads_by_Individuals.csv
Note that any generated files, e.g. HTML, png, CSS, etc., are not included in this status report because it is ok for generated content to have uncommitted changes.
These are the previous versions of the repository in which changes were
made to the R Markdown (analysis/DGE_Analysis.Rmd) and HTML
(docs/DGE_Analysis.html) files. If you’ve configured a
remote Git repository (see ?wflow_git_remote), click on the
hyperlinks in the table below to view the files as they were in that
past version.
| File | Version | Author | Date | Message |
|---|---|---|---|---|
| html | 570ce4f | sayanpaul01 | 2025-06-08 | Commit |
| Rmd | 25d4fd9 | sayanpaul01 | 2025-06-08 | Commit |
| html | 25d4fd9 | sayanpaul01 | 2025-06-08 | Commit |
| Rmd | eab1afc | sayanpaul01 | 2025-05-23 | Commit |
| html | eab1afc | sayanpaul01 | 2025-05-23 | Commit |
| html | 576c23e | sayanpaul01 | 2025-05-13 | Commit |
| Rmd | 48c7dd9 | sayanpaul01 | 2025-05-13 | Commit |
| html | 48c7dd9 | sayanpaul01 | 2025-05-13 | Commit |
| Rmd | 5a1db81 | sayanpaul01 | 2025-05-09 | Commit |
| html | 5a1db81 | sayanpaul01 | 2025-05-09 | Commit |
| html | dcf1e50 | sayanpaul01 | 2025-05-09 | Commit |
| Rmd | 3d33304 | sayanpaul01 | 2025-05-09 | Commit |
| html | 3d33304 | sayanpaul01 | 2025-05-09 | Commit |
| Rmd | 72226f1 | sayanpaul01 | 2025-05-09 | Commit |
| html | 72226f1 | sayanpaul01 | 2025-05-09 | Commit |
| Rmd | 328c60f | sayanpaul01 | 2025-05-08 | Commit |
| html | 328c60f | sayanpaul01 | 2025-05-08 | Commit |
| Rmd | d11a2ea | sayanpaul01 | 2025-05-08 | Commit |
| html | d11a2ea | sayanpaul01 | 2025-05-08 | Commit |
| Rmd | 711098f | sayanpaul01 | 2025-05-08 | Commit |
| html | 711098f | sayanpaul01 | 2025-05-08 | Commit |
| html | 72b1144 | sayanpaul01 | 2025-05-08 | Commit |
| Rmd | db482f6 | sayanpaul01 | 2025-05-08 | Commit |
| html | db482f6 | sayanpaul01 | 2025-05-08 | Commit |
| Rmd | 43e348d | sayanpaul01 | 2025-05-08 | Commit |
| html | 43e348d | sayanpaul01 | 2025-05-08 | Commit |
| Rmd | 92099e7 | sayanpaul01 | 2025-05-08 | Commit |
| html | 92099e7 | sayanpaul01 | 2025-05-08 | Commit |
| html | a6d66b9 | sayanpaul01 | 2025-02-07 | Build site. |
| Rmd | 918f852 | sayanpaul01 | 2025-02-07 | Save Toptables for LogFC correlation |
| html | 7698b5e | sayanpaul01 | 2025-02-06 | Build site. |
| html | 1c03f60 | sayanpaul01 | 2025-02-06 | Build site. |
| Rmd | 0a87308 | sayanpaul01 | 2025-02-06 | Save Toptables for LogFC correlation |
| html | 9ba22e3 | sayanpaul01 | 2025-02-06 | Build site. |
| Rmd | 9f3ac07 | sayanpaul01 | 2025-02-06 | Added Volcano Plots for all DEGs |
| html | 705bc0b | sayanpaul01 | 2025-02-06 | Build site. |
| Rmd | 8bfc319 | sayanpaul01 | 2025-02-06 | wflow_publish("analysis/DGE_Analysis.Rmd") |
| html | 12a9a6b | sayanpaul01 | 2025-02-06 | Build site. |
| Rmd | eebe7d2 | sayanpaul01 | 2025-02-06 | wflow_publish("analysis/DGE_Analysis.Rmd") |
| html | 1ab310a | sayanpaul01 | 2025-02-06 | Build site. |
| Rmd | 4306834 | sayanpaul01 | 2025-02-06 | Added mean-variance trend plot |
| html | f59d02b | sayanpaul01 | 2025-02-06 | Build site. |
| Rmd | 3f764ee | sayanpaul01 | 2025-02-06 | Added DGE Analysis with structured chunks |
| html | d6850ef | sayanpaul01 | 2025-02-06 | Build site. |
| Rmd | d31730d | sayanpaul01 | 2025-02-06 | Added DGE Analysis with structured chunks |
📌 Differential Gene Expression Analysis
📌 Load Required Libraries
# Load necessary packages
library(edgeR)
Warning: package 'edgeR' was built under R version 4.3.2Warning: package 'limma' was built under R version 4.3.1library(limma)
library(data.table)Warning: package 'data.table' was built under R version 4.3.3library(tidyverse)Warning: package 'tidyverse' was built under R version 4.3.2Warning: package 'tidyr' was built under R version 4.3.3Warning: package 'readr' was built under R version 4.3.3Warning: package 'purrr' was built under R version 4.3.3Warning: package 'dplyr' was built under R version 4.3.2Warning: package 'stringr' was built under R version 4.3.2Warning: package 'lubridate' was built under R version 4.3.3library(ggplot2)
library(dplyr)
library(scales)Warning: package 'scales' was built under R version 4.3.2library(biomaRt)Warning: package 'biomaRt' was built under R version 4.3.2library(Homo.sapiens)Warning: package 'AnnotationDbi' was built under R version 4.3.2Warning: package 'BiocGenerics' was built under R version 4.3.1Warning: package 'Biobase' was built under R version 4.3.1Warning: package 'IRanges' was built under R version 4.3.1Warning: package 'S4Vectors' was built under R version 4.3.2Warning: package 'OrganismDbi' was built under R version 4.3.1Warning: package 'GenomicFeatures' was built under R version 4.3.3Warning: package 'GenomeInfoDb' was built under R version 4.3.3Warning: package 'GenomicRanges' was built under R version 4.3.1📍 Load Data
📌 Normalize and Filter Counts
📌 Prepare DGEList Object
# Subset count matrix based on filtered CPM matrix
x <- counts_matrix[row.names(filcpm_matrix),]
dim(x)
[1] 14279 108# Modify Metadata
Metadata_2 <- Metadata
rownames(Metadata_2) <- Metadata_2$Sample_bam
colnames(x) <- Metadata_2$Sample_ID
rownames(Metadata_2) <- Metadata_2$Sample_ID
Metadata_2$Drug_time <- make.names(Metadata_2$Drug_time)
Metadata_2$Ind <- as.character(Metadata_2$Ind)
# ✅ Create DGEList object
dge <- DGEList(counts = x)
dge$samples$group <- factor(Metadata_2$Drug_time)
dge <- calcNormFactors(dge, method = "TMM")
# ✅ Check normalization factors
dge$samples group lib.size norm.factors
CX-5461_0.1_3_17-3 CX.5461_0.1_3 21200035 1.0102693
DOX_0.5_24_17-3 DOX_0.5_24 16563771 1.1076182
DOX_0.5_24_87-1 DOX_0.5_24 21656653 0.9933568
VEH_0.1_24_87-1 VEH_0.1_24 22426842 0.9766783
VEH_0.5_24_87-1 VEH_0.5_24 22162275 0.9924549
CX-5461_0.1_48_87-1 CX.5461_0.1_48 22187620 0.9683497
CX-5461_0.5_48_87-1 CX.5461_0.5_48 20782167 0.9814665
DOX_0.1_48_87-1 DOX_0.1_48 25382841 1.0011030
DOX_0.5_48_87-1 DOX_0.5_48 19863531 1.0541528
VEH_0.1_48_87-1 VEH_0.1_48 21473253 1.0138011
VEH_0.5_48_87-1 VEH_0.5_48 20337337 1.0219756
VEH_0.1_24_17-3 VEH_0.1_24 15750538 0.9952313
VEH_0.5_24_17-3 VEH_0.5_24 15638967 1.0367909
CX-5461_0.1_48_17-3 CX.5461_0.1_48 18465522 0.9543636
CX-5461_0.5_48_17-3 CX.5461_0.5_48 16876134 0.9636074
DOX_0.1_48_17-3 DOX_0.1_48 20609601 0.9839708
DOX_0.5_48_17-3 DOX_0.5_48 18829944 1.1876478
VEH_0.1_48_17-3 VEH_0.1_48 24712537 0.9804184
VEH_0.5_48_17-3 VEH_0.5_48 17006648 0.9707617
CX-5461_0.1_3_84-1 CX.5461_0.1_3 17178171 1.0219387
CX-5461_0.5_3_17-3 CX.5461_0.5_3 17694385 1.0103837
CX-5461_0.5_3_84-1 CX.5461_0.5_3 17261114 1.0060170
DOX_0.1_3_84-1 DOX_0.1_3 17352493 0.9911466
DOX_0.5_3_84-1 DOX_0.5_3 17757477 1.0034479
VEH_0.1_3_84-1 VEH_0.1_3 19305213 1.0354377
VEH_0.5_3_84-1 VEH_0.5_3 17297185 1.0285524
CX-5461_0.1_24_84-1 CX.5461_0.1_24 23860498 0.9857321
CX-5461_0.5_24_84-1 CX.5461_0.5_24 19482159 0.9638391
DOX_0.1_24_84-1 DOX_0.1_24 19659504 0.9565317
DOX_0.5_24_84-1 DOX_0.5_24 17875612 1.0212021
VEH_0.1_24_84-1 VEH_0.1_24 16449210 0.9998393
DOX_0.1_3_17-3 DOX_0.1_3 16400599 0.9962197
VEH_0.5_24_84-1 VEH_0.5_24 18783630 0.9616033
CX-5461_0.1_48_84-1 CX.5461_0.1_48 13781326 0.9400278
CX-5461_0.5_48_84-1 CX.5461_0.5_48 20232591 0.9563694
DOX_0.1_48_84-1 DOX_0.1_48 16028063 0.9651474
DOX_0.5_48_84-1 DOX_0.5_48 16269098 1.0652791
VEH_0.1_48_84-1 VEH_0.1_48 15276408 0.9612979
VEH_0.5_48_84-1 VEH_0.5_48 17447290 1.0050272
CX-5461_0.1_3_90-1 CX.5461_0.1_3 15807726 0.9991915
CX-5461_0.5_3_90-1 CX.5461_0.5_3 17946649 0.9956913
DOX_0.1_3_90-1 DOX_0.1_3 20294777 0.9830679
DOX_0.5_3_17-3 DOX_0.5_3 18191217 0.9080939
DOX_0.5_3_90-1 DOX_0.5_3 20699125 0.9833929
VEH_0.1_3_90-1 VEH_0.1_3 20027541 0.9953796
VEH_0.5_3_90-1 VEH_0.5_3 17833214 1.0003025
CX-5461_0.1_24_90-1 CX.5461_0.1_24 15094639 1.0102577
CX-5461_0.5_24_90-1 CX.5461_0.5_24 17758047 1.0114258
DOX_0.1_24_90-1 DOX_0.1_24 16921727 0.9900805
DOX_0.5_24_90-1 DOX_0.5_24 19271264 1.0068767
VEH_0.1_24_90-1 VEH_0.1_24 20601703 0.9898691
VEH_0.5_24_90-1 VEH_0.5_24 19875553 1.0060950
CX-5461_0.1_48_90-1 CX.5461_0.1_48 23817456 1.0255425
VEH_0.1_3_17-3 VEH_0.1_3 26353255 0.9919794
CX-5461_0.5_48_90-1 CX.5461_0.5_48 18651093 1.0370010
DOX_0.1_48_90-1 DOX_0.1_48 17767662 1.0233343
DOX_0.5_48_90-1 DOX_0.5_48 20031141 1.1189284
VEH_0.1_48_90-1 VEH_0.1_48 19523120 1.0484497
VEH_0.5_48_90-1 VEH_0.5_48 17657193 1.0550052
CX-5461_0.1_3_75-1 CX.5461_0.1_3 20046785 0.9894881
CX-5461_0.5_3_75-1 CX.5461_0.5_3 19885297 0.9767025
DOX_0.1_3_75-1 DOX_0.1_3 18575114 0.9755788
DOX_0.5_3_75-1 DOX_0.5_3 15260497 0.9562336
VEH_0.1_3_75-1 VEH_0.1_3 19040007 0.9839769
VEH_0.5_3_17-3 VEH_0.5_3 18217503 0.9735069
VEH_0.5_3_75-1 VEH_0.5_3 21311999 0.9663251
CX-5461_0.1_24_75-1 CX.5461_0.1_24 19256517 1.0184093
CX-5461_0.5_24_75-1 CX.5461_0.5_24 14304255 1.0186309
DOX_0.1_24_75-1 DOX_0.1_24 21875105 1.0386302
DOX_0.5_24_75-1 DOX_0.5_24 17032433 0.9686987
VEH_0.1_24_75-1 VEH_0.1_24 19796422 1.0295019
VEH_0.5_24_75-1 VEH_0.5_24 21524523 1.0376940
CX-5461_0.1_48_75-1 CX.5461_0.1_48 20955873 0.9752971
CX-5461_0.5_48_75-1 CX.5461_0.5_48 19924867 0.9768371
DOX_0.1_48_75-1 DOX_0.1_48 17698471 1.0369925
CX-5461_0.1_24_17-3 CX.5461_0.1_24 18239213 0.9808618
DOX_0.5_48_75-1 DOX_0.5_48 15422887 1.0296304
VEH_0.1_48_75-1 VEH_0.1_48 21014387 1.0100812
VEH_0.5_48_75-1 VEH_0.5_48 21346438 1.0015670
CX-5461_0.1_3_78-1 CX.5461_0.1_3 20824890 0.9686975
CX-5461_0.5_3_78-1 CX.5461_0.5_3 19425405 1.0100551
DOX_0.1_3_78-1 DOX_0.1_3 18950843 0.9933529
DOX_0.5_3_78-1 DOX_0.5_3 21654404 0.9808038
VEH_0.1_3_78-1 VEH_0.1_3 20054872 0.9802655
VEH_0.5_3_78-1 VEH_0.5_3 17661233 1.0220629
CX-5461_0.1_24_78-1 CX.5461_0.1_24 16754941 0.9785599
CX-5461_0.5_24_17-3 CX.5461_0.5_24 16014473 1.0010257
CX-5461_0.5_24_78-1 CX.5461_0.5_24 16077548 0.9819166
DOX_0.1_24_78-1 DOX_0.1_24 27842910 0.9788383
DOX_0.5_24_78-1 DOX_0.5_24 6326261 1.0007627
VEH_0.1_24_78-1 VEH_0.1_24 18032196 0.9767098
VEH_0.5_24_78-1 VEH_0.5_24 18727398 0.9931695
CX-5461_0.1_48_78-1 CX.5461_0.1_48 21292146 1.0036183
CX-5461_0.5_48_78-1 CX.5461_0.5_48 18392707 0.9988905
DOX_0.1_48_78-1 DOX_0.1_48 18735925 1.0433629
DOX_0.5_48_78-1 DOX_0.5_48 16079343 1.1063695
VEH_0.1_48_78-1 VEH_0.1_48 20500742 1.0149206
DOX_0.1_24_17-3 DOX_0.1_24 23900805 1.0243090
VEH_0.5_48_78-1 VEH_0.5_48 18433692 1.0396358
CX-5461_0.1_3_87-1 CX.5461_0.1_3 19664754 0.9573708
CX-5461_0.5_3_87-1 CX.5461_0.5_3 21451819 1.0192062
DOX_0.1_3_87-1 DOX_0.1_3 20624889 0.9539861
DOX_0.5_3_87-1 DOX_0.5_3 22838835 0.9919424
VEH_0.1_3_87-1 VEH_0.1_3 17616767 0.9841881
VEH_0.5_3_87-1 VEH_0.5_3 22148086 1.0203028
CX-5461_0.1_24_87-1 CX.5461_0.1_24 30093416 0.9439250
CX-5461_0.5_24_87-1 CX.5461_0.5_24 22093483 0.9589794
DOX_0.1_24_87-1 DOX_0.1_24 21415578 0.9549937📌 Create Design Matrix
# ✅ Create Design Matrix
design <- model.matrix(~ 0 + Metadata_2$Drug_time)
colnames(design) <- gsub("Metadata_2\\$Drug_time", "", colnames(design))
design
CX.5461_0.1_24 CX.5461_0.1_3 CX.5461_0.1_48 CX.5461_0.5_24 CX.5461_0.5_3
1 0 1 0 0 0
2 0 0 0 0 0
3 0 0 0 0 0
4 0 0 0 0 0
5 0 0 0 0 0
6 0 0 1 0 0
7 0 0 0 0 0
8 0 0 0 0 0
9 0 0 0 0 0
10 0 0 0 0 0
11 0 0 0 0 0
12 0 0 0 0 0
13 0 0 0 0 0
14 0 0 1 0 0
15 0 0 0 0 0
16 0 0 0 0 0
17 0 0 0 0 0
18 0 0 0 0 0
19 0 0 0 0 0
20 0 1 0 0 0
21 0 0 0 0 1
22 0 0 0 0 1
23 0 0 0 0 0
24 0 0 0 0 0
25 0 0 0 0 0
26 0 0 0 0 0
27 1 0 0 0 0
28 0 0 0 1 0
29 0 0 0 0 0
30 0 0 0 0 0
31 0 0 0 0 0
32 0 0 0 0 0
33 0 0 0 0 0
34 0 0 1 0 0
35 0 0 0 0 0
36 0 0 0 0 0
37 0 0 0 0 0
38 0 0 0 0 0
39 0 0 0 0 0
40 0 1 0 0 0
41 0 0 0 0 1
42 0 0 0 0 0
43 0 0 0 0 0
44 0 0 0 0 0
45 0 0 0 0 0
46 0 0 0 0 0
47 1 0 0 0 0
48 0 0 0 1 0
49 0 0 0 0 0
50 0 0 0 0 0
51 0 0 0 0 0
52 0 0 0 0 0
53 0 0 1 0 0
54 0 0 0 0 0
55 0 0 0 0 0
56 0 0 0 0 0
57 0 0 0 0 0
58 0 0 0 0 0
59 0 0 0 0 0
60 0 1 0 0 0
61 0 0 0 0 1
62 0 0 0 0 0
63 0 0 0 0 0
64 0 0 0 0 0
65 0 0 0 0 0
66 0 0 0 0 0
67 1 0 0 0 0
68 0 0 0 1 0
69 0 0 0 0 0
70 0 0 0 0 0
71 0 0 0 0 0
72 0 0 0 0 0
73 0 0 1 0 0
74 0 0 0 0 0
75 0 0 0 0 0
76 1 0 0 0 0
77 0 0 0 0 0
78 0 0 0 0 0
79 0 0 0 0 0
80 0 1 0 0 0
81 0 0 0 0 1
82 0 0 0 0 0
83 0 0 0 0 0
84 0 0 0 0 0
85 0 0 0 0 0
86 1 0 0 0 0
87 0 0 0 1 0
88 0 0 0 1 0
89 0 0 0 0 0
90 0 0 0 0 0
91 0 0 0 0 0
92 0 0 0 0 0
93 0 0 1 0 0
94 0 0 0 0 0
95 0 0 0 0 0
96 0 0 0 0 0
97 0 0 0 0 0
98 0 0 0 0 0
99 0 0 0 0 0
100 0 1 0 0 0
101 0 0 0 0 1
102 0 0 0 0 0
103 0 0 0 0 0
104 0 0 0 0 0
105 0 0 0 0 0
106 1 0 0 0 0
107 0 0 0 1 0
108 0 0 0 0 0
CX.5461_0.5_48 DOX_0.1_24 DOX_0.1_3 DOX_0.1_48 DOX_0.5_24 DOX_0.5_3
1 0 0 0 0 0 0
2 0 0 0 0 1 0
3 0 0 0 0 1 0
4 0 0 0 0 0 0
5 0 0 0 0 0 0
6 0 0 0 0 0 0
7 1 0 0 0 0 0
8 0 0 0 1 0 0
9 0 0 0 0 0 0
10 0 0 0 0 0 0
11 0 0 0 0 0 0
12 0 0 0 0 0 0
13 0 0 0 0 0 0
14 0 0 0 0 0 0
15 1 0 0 0 0 0
16 0 0 0 1 0 0
17 0 0 0 0 0 0
18 0 0 0 0 0 0
19 0 0 0 0 0 0
20 0 0 0 0 0 0
21 0 0 0 0 0 0
22 0 0 0 0 0 0
23 0 0 1 0 0 0
24 0 0 0 0 0 1
25 0 0 0 0 0 0
26 0 0 0 0 0 0
27 0 0 0 0 0 0
28 0 0 0 0 0 0
29 0 1 0 0 0 0
30 0 0 0 0 1 0
31 0 0 0 0 0 0
32 0 0 1 0 0 0
33 0 0 0 0 0 0
34 0 0 0 0 0 0
35 1 0 0 0 0 0
36 0 0 0 1 0 0
37 0 0 0 0 0 0
38 0 0 0 0 0 0
39 0 0 0 0 0 0
40 0 0 0 0 0 0
41 0 0 0 0 0 0
42 0 0 1 0 0 0
43 0 0 0 0 0 1
44 0 0 0 0 0 1
45 0 0 0 0 0 0
46 0 0 0 0 0 0
47 0 0 0 0 0 0
48 0 0 0 0 0 0
49 0 1 0 0 0 0
50 0 0 0 0 1 0
51 0 0 0 0 0 0
52 0 0 0 0 0 0
53 0 0 0 0 0 0
54 0 0 0 0 0 0
55 1 0 0 0 0 0
56 0 0 0 1 0 0
57 0 0 0 0 0 0
58 0 0 0 0 0 0
59 0 0 0 0 0 0
60 0 0 0 0 0 0
61 0 0 0 0 0 0
62 0 0 1 0 0 0
63 0 0 0 0 0 1
64 0 0 0 0 0 0
65 0 0 0 0 0 0
66 0 0 0 0 0 0
67 0 0 0 0 0 0
68 0 0 0 0 0 0
69 0 1 0 0 0 0
70 0 0 0 0 1 0
71 0 0 0 0 0 0
72 0 0 0 0 0 0
73 0 0 0 0 0 0
74 1 0 0 0 0 0
75 0 0 0 1 0 0
76 0 0 0 0 0 0
77 0 0 0 0 0 0
78 0 0 0 0 0 0
79 0 0 0 0 0 0
80 0 0 0 0 0 0
81 0 0 0 0 0 0
82 0 0 1 0 0 0
83 0 0 0 0 0 1
84 0 0 0 0 0 0
85 0 0 0 0 0 0
86 0 0 0 0 0 0
87 0 0 0 0 0 0
88 0 0 0 0 0 0
89 0 1 0 0 0 0
90 0 0 0 0 1 0
91 0 0 0 0 0 0
92 0 0 0 0 0 0
93 0 0 0 0 0 0
94 1 0 0 0 0 0
95 0 0 0 1 0 0
96 0 0 0 0 0 0
97 0 0 0 0 0 0
98 0 1 0 0 0 0
99 0 0 0 0 0 0
100 0 0 0 0 0 0
101 0 0 0 0 0 0
102 0 0 1 0 0 0
103 0 0 0 0 0 1
104 0 0 0 0 0 0
105 0 0 0 0 0 0
106 0 0 0 0 0 0
107 0 0 0 0 0 0
108 0 1 0 0 0 0
DOX_0.5_48 VEH_0.1_24 VEH_0.1_3 VEH_0.1_48 VEH_0.5_24 VEH_0.5_3 VEH_0.5_48
1 0 0 0 0 0 0 0
2 0 0 0 0 0 0 0
3 0 0 0 0 0 0 0
4 0 1 0 0 0 0 0
5 0 0 0 0 1 0 0
6 0 0 0 0 0 0 0
7 0 0 0 0 0 0 0
8 0 0 0 0 0 0 0
9 1 0 0 0 0 0 0
10 0 0 0 1 0 0 0
11 0 0 0 0 0 0 1
12 0 1 0 0 0 0 0
13 0 0 0 0 1 0 0
14 0 0 0 0 0 0 0
15 0 0 0 0 0 0 0
16 0 0 0 0 0 0 0
17 1 0 0 0 0 0 0
18 0 0 0 1 0 0 0
19 0 0 0 0 0 0 1
20 0 0 0 0 0 0 0
21 0 0 0 0 0 0 0
22 0 0 0 0 0 0 0
23 0 0 0 0 0 0 0
24 0 0 0 0 0 0 0
25 0 0 1 0 0 0 0
26 0 0 0 0 0 1 0
27 0 0 0 0 0 0 0
28 0 0 0 0 0 0 0
29 0 0 0 0 0 0 0
30 0 0 0 0 0 0 0
31 0 1 0 0 0 0 0
32 0 0 0 0 0 0 0
33 0 0 0 0 1 0 0
34 0 0 0 0 0 0 0
35 0 0 0 0 0 0 0
36 0 0 0 0 0 0 0
37 1 0 0 0 0 0 0
38 0 0 0 1 0 0 0
39 0 0 0 0 0 0 1
40 0 0 0 0 0 0 0
41 0 0 0 0 0 0 0
42 0 0 0 0 0 0 0
43 0 0 0 0 0 0 0
44 0 0 0 0 0 0 0
45 0 0 1 0 0 0 0
46 0 0 0 0 0 1 0
47 0 0 0 0 0 0 0
48 0 0 0 0 0 0 0
49 0 0 0 0 0 0 0
50 0 0 0 0 0 0 0
51 0 1 0 0 0 0 0
52 0 0 0 0 1 0 0
53 0 0 0 0 0 0 0
54 0 0 1 0 0 0 0
55 0 0 0 0 0 0 0
56 0 0 0 0 0 0 0
57 1 0 0 0 0 0 0
58 0 0 0 1 0 0 0
59 0 0 0 0 0 0 1
60 0 0 0 0 0 0 0
61 0 0 0 0 0 0 0
62 0 0 0 0 0 0 0
63 0 0 0 0 0 0 0
64 0 0 1 0 0 0 0
65 0 0 0 0 0 1 0
66 0 0 0 0 0 1 0
67 0 0 0 0 0 0 0
68 0 0 0 0 0 0 0
69 0 0 0 0 0 0 0
70 0 0 0 0 0 0 0
71 0 1 0 0 0 0 0
72 0 0 0 0 1 0 0
73 0 0 0 0 0 0 0
74 0 0 0 0 0 0 0
75 0 0 0 0 0 0 0
76 0 0 0 0 0 0 0
77 1 0 0 0 0 0 0
78 0 0 0 1 0 0 0
79 0 0 0 0 0 0 1
80 0 0 0 0 0 0 0
81 0 0 0 0 0 0 0
82 0 0 0 0 0 0 0
83 0 0 0 0 0 0 0
84 0 0 1 0 0 0 0
85 0 0 0 0 0 1 0
86 0 0 0 0 0 0 0
87 0 0 0 0 0 0 0
88 0 0 0 0 0 0 0
89 0 0 0 0 0 0 0
90 0 0 0 0 0 0 0
91 0 1 0 0 0 0 0
92 0 0 0 0 1 0 0
93 0 0 0 0 0 0 0
94 0 0 0 0 0 0 0
95 0 0 0 0 0 0 0
96 1 0 0 0 0 0 0
97 0 0 0 1 0 0 0
98 0 0 0 0 0 0 0
99 0 0 0 0 0 0 1
100 0 0 0 0 0 0 0
101 0 0 0 0 0 0 0
102 0 0 0 0 0 0 0
103 0 0 0 0 0 0 0
104 0 0 1 0 0 0 0
105 0 0 0 0 0 1 0
106 0 0 0 0 0 0 0
107 0 0 0 0 0 0 0
108 0 0 0 0 0 0 0
attr(,"assign")
[1] 1 1 1 1 1 1 1 1 1 1 1 1 1 1 1 1 1 1
attr(,"contrasts")
attr(,"contrasts")$`Metadata_2$Drug_time`
[1] "contr.treatment"📌 Voom Transformation and Linear Modeling
# ✅ Duplicate Correlation for Individual Effect
corfit <- duplicateCorrelation(object = dge$counts, design = design, block = Metadata_2$Ind)

# ✅ Voom Transformation
v <- voom(dge, design, block = Metadata_2$Ind, correlation = corfit$consensus.correlation, plot = TRUE)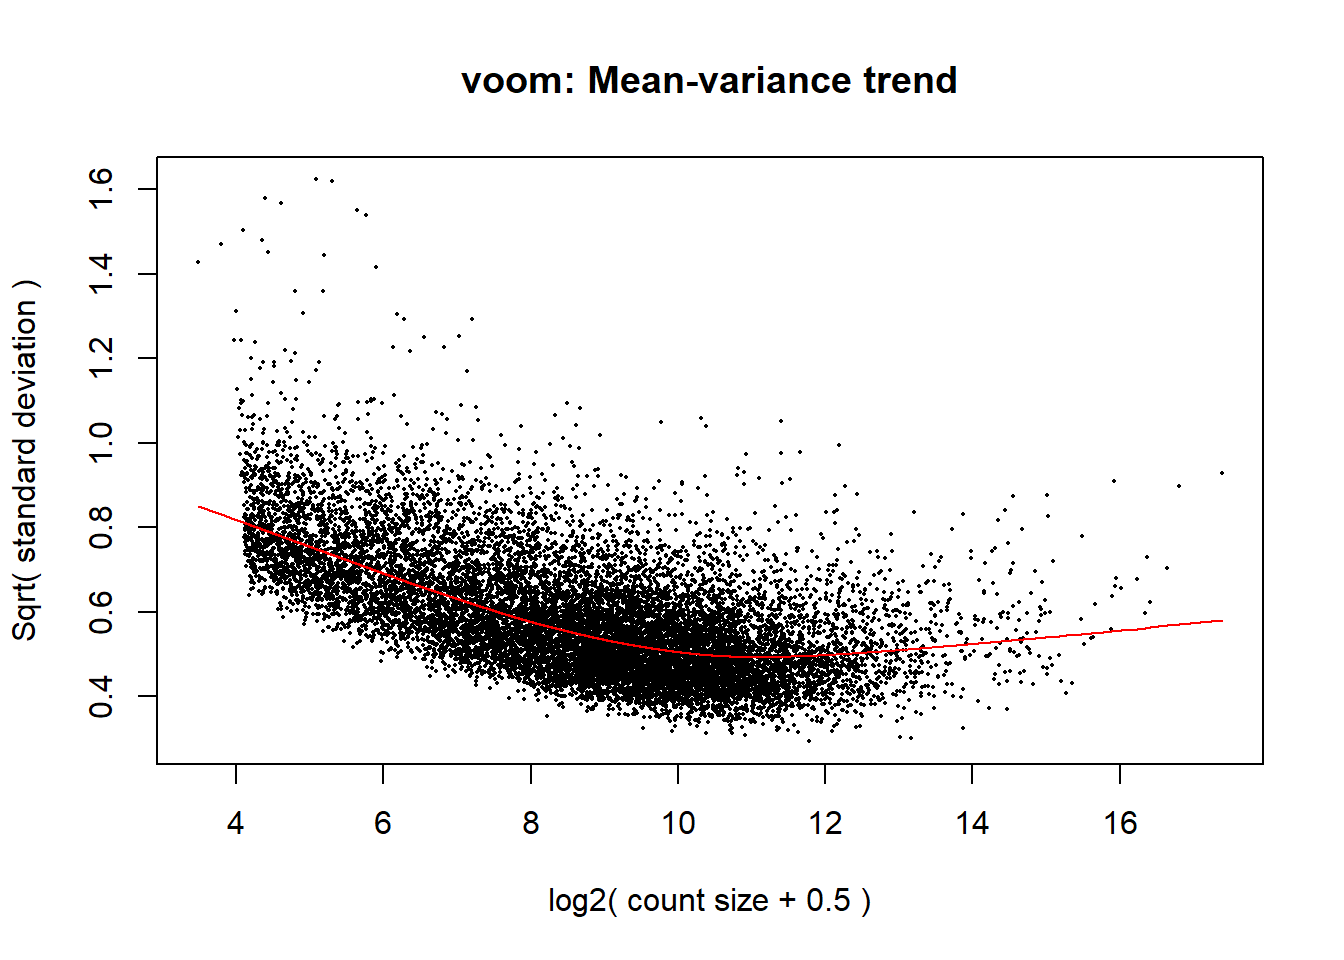
# ✅ Fit Linear Model
fit <- lmFit(v, design, block = Metadata_2$Ind, correlation = corfit$consensus.correlation)
📌 Create Contrast Matrix
contrast_matrix <- makeContrasts(
  CX_0.1_3vsVEH_0.1_3 = CX.5461_0.1_3 - VEH_0.1_3,
  CX_0.1_24vsVEH_0.1_24 = CX.5461_0.1_24 - VEH_0.1_24,
  CX_0.1_48vsVEH_0.1_48 = CX.5461_0.1_48 - VEH_0.1_48,
  CX_0.5_3vsVEH_0.5_3 = CX.5461_0.5_3 - VEH_0.5_3,
  CX_0.5_24vsVEH_0.5_24 = CX.5461_0.5_24 - VEH_0.5_24,
  CX_0.5_48vsVEH_0.5_48 = CX.5461_0.5_48 - VEH_0.5_48,
  DOX_0.1_3vsVEH_0.1_3 = DOX_0.1_3 - VEH_0.1_3,
  DOX_0.1_24vsVEH_0.1_24 = DOX_0.1_24 - VEH_0.1_24,
  DOX_0.1_48vsVEH_0.1_48 = DOX_0.1_48 - VEH_0.1_48,
  DOX_0.5_3vsVEH_0.5_3 = DOX_0.5_3 - VEH_0.5_3,
  DOX_0.5_24vsVEH_0.5_24 = DOX_0.5_24 - VEH_0.5_24,
  DOX_0.5_48vsVEH_0.5_48 = DOX_0.5_48 - VEH_0.5_48,
  levels = design
)
📌 Fit Model and Generate Results
# ✅ Apply Contrasts
fit2 <- contrasts.fit(fit, contrast_matrix)
fit2 <- eBayes(fit2)
📌 Mean-Variance Trend Plot
# Plot Mean-Variance Trend
plotSA(fit2, main = "Final model: Mean-Variance trend")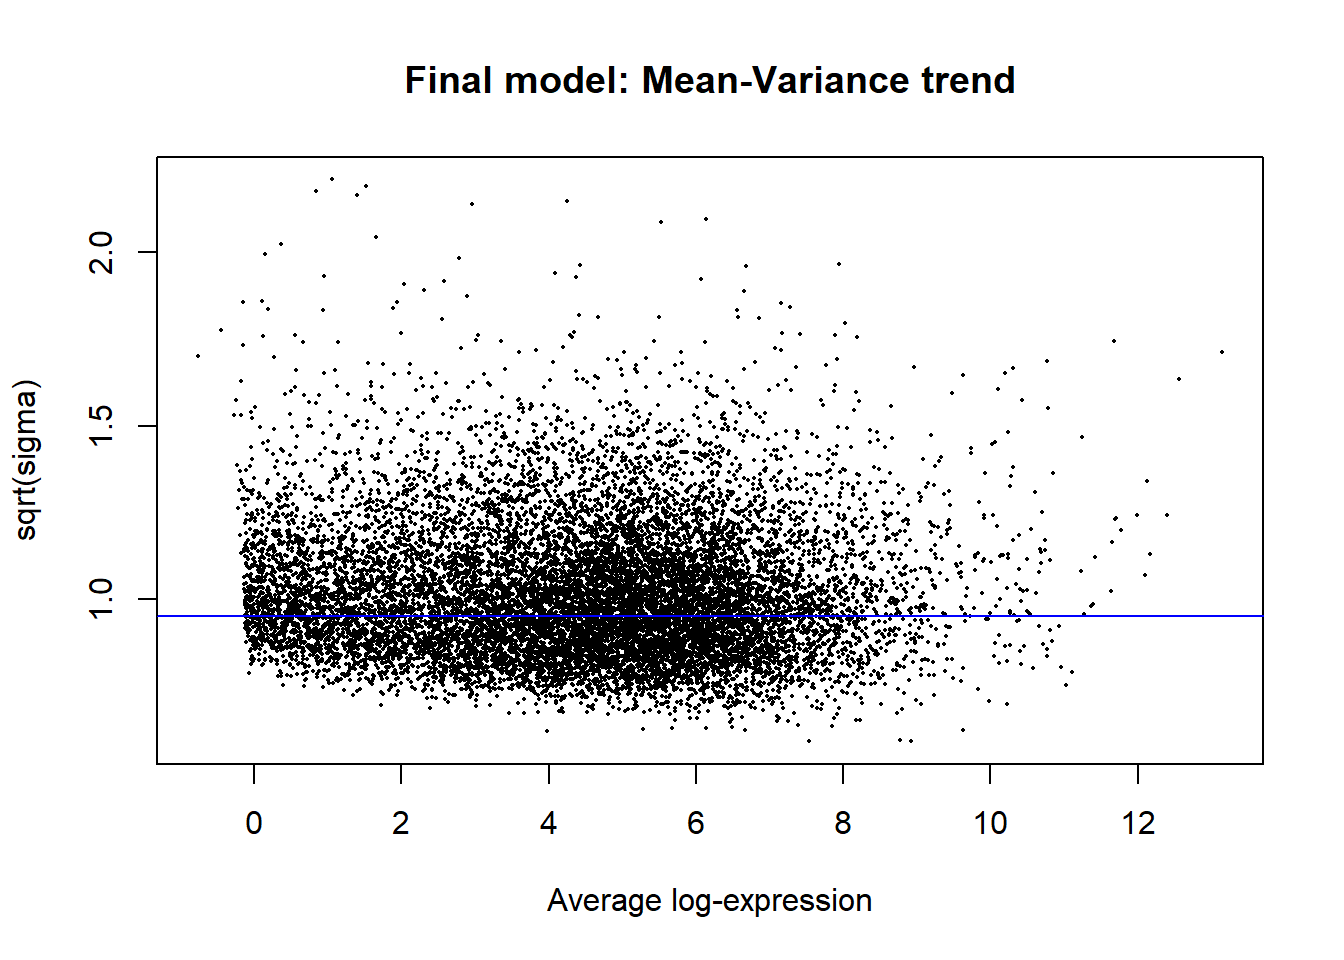
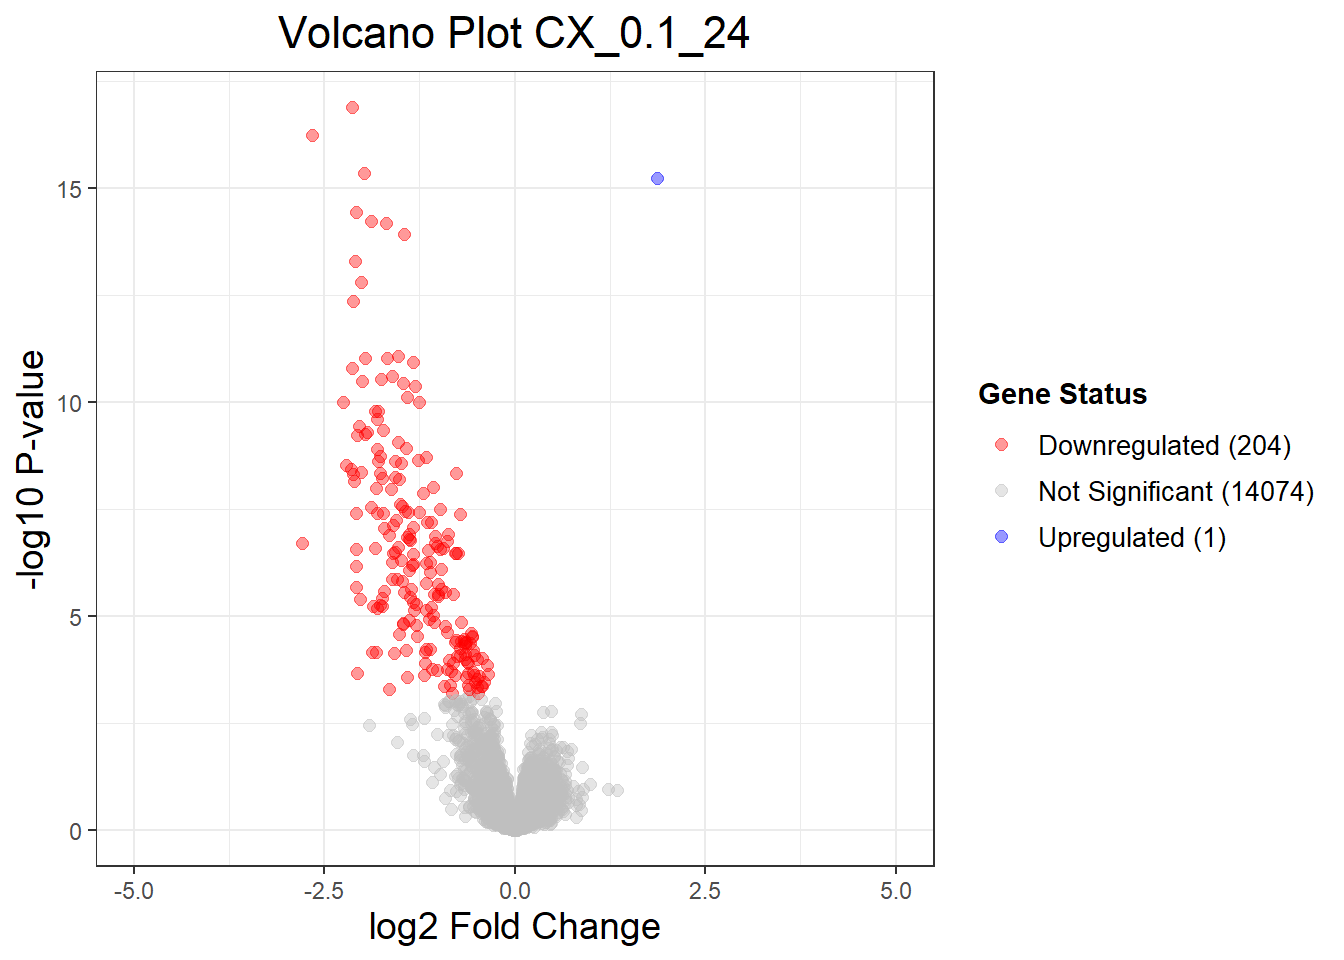
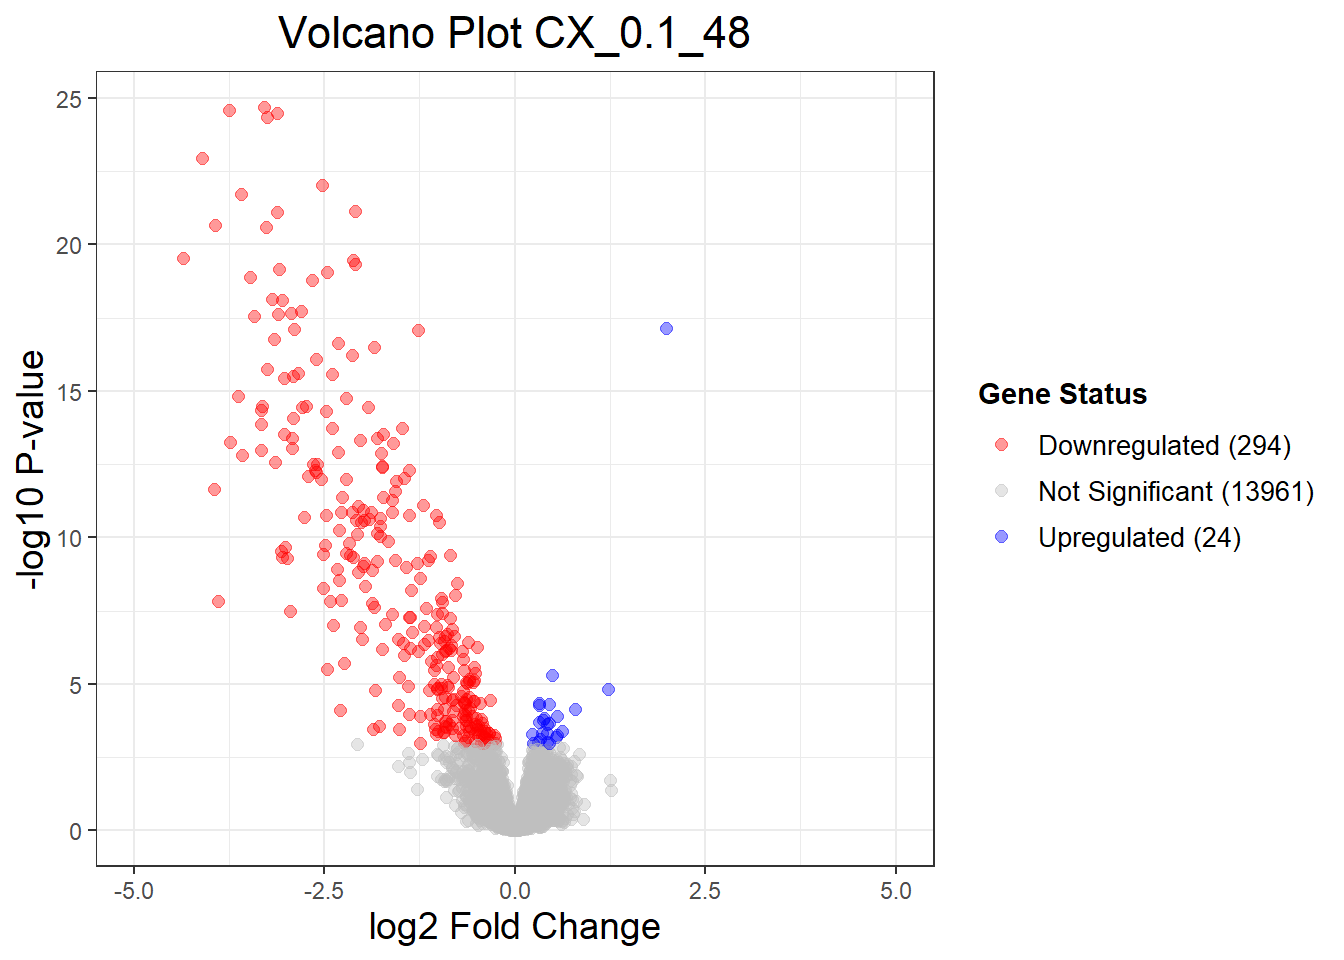
📌Summary of Results
# ✅ Summary of Results
results_summary <- decideTests(fit2, adjust.method = "BH", p.value = 0.05)
summary(results_summary)
CX_0.1_3vsVEH_0.1_3 CX_0.1_24vsVEH_0.1_24 CX_0.1_48vsVEH_0.1_48
Down 0 204 294
NotSig 14278 14074 13961
Up 1 1 24
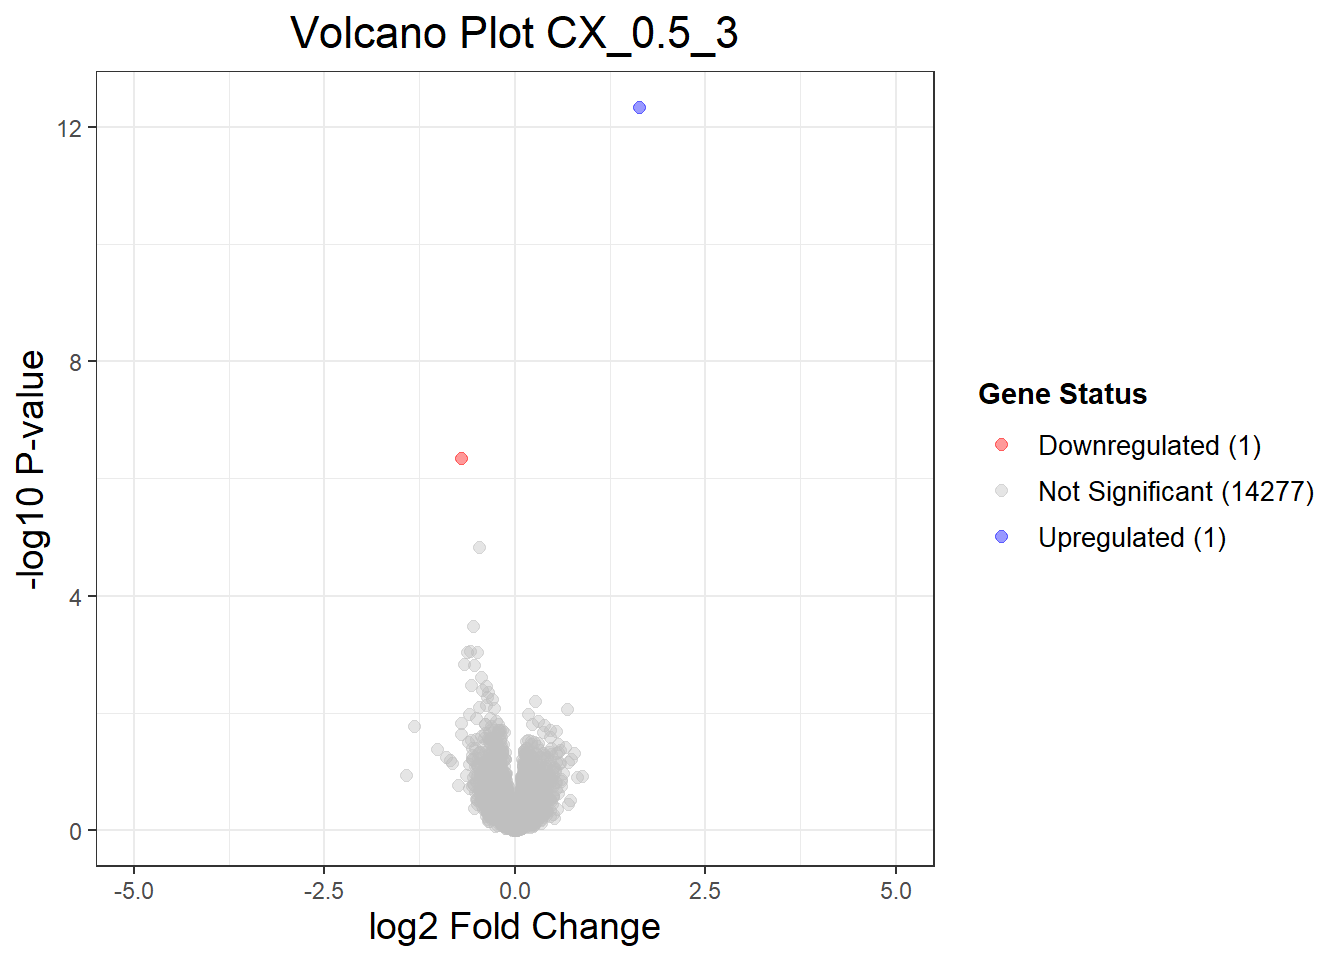
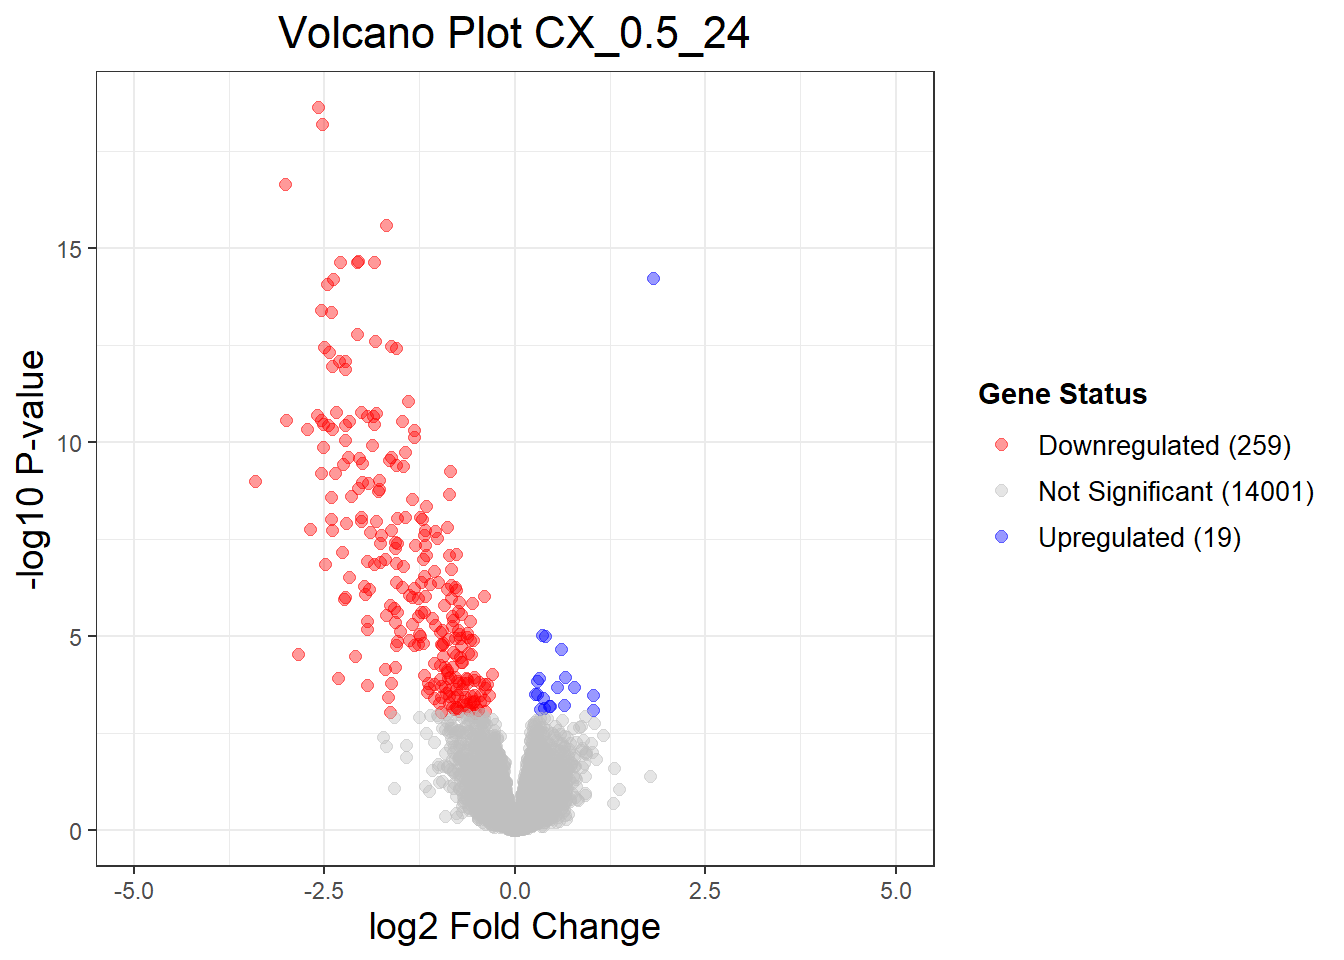
CX_0.5_3vsVEH_0.5_3 CX_0.5_24vsVEH_0.5_24 CX_0.5_48vsVEH_0.5_48
Down 1 259 337
NotSig 14277 14001 13909
Up 1 19 33
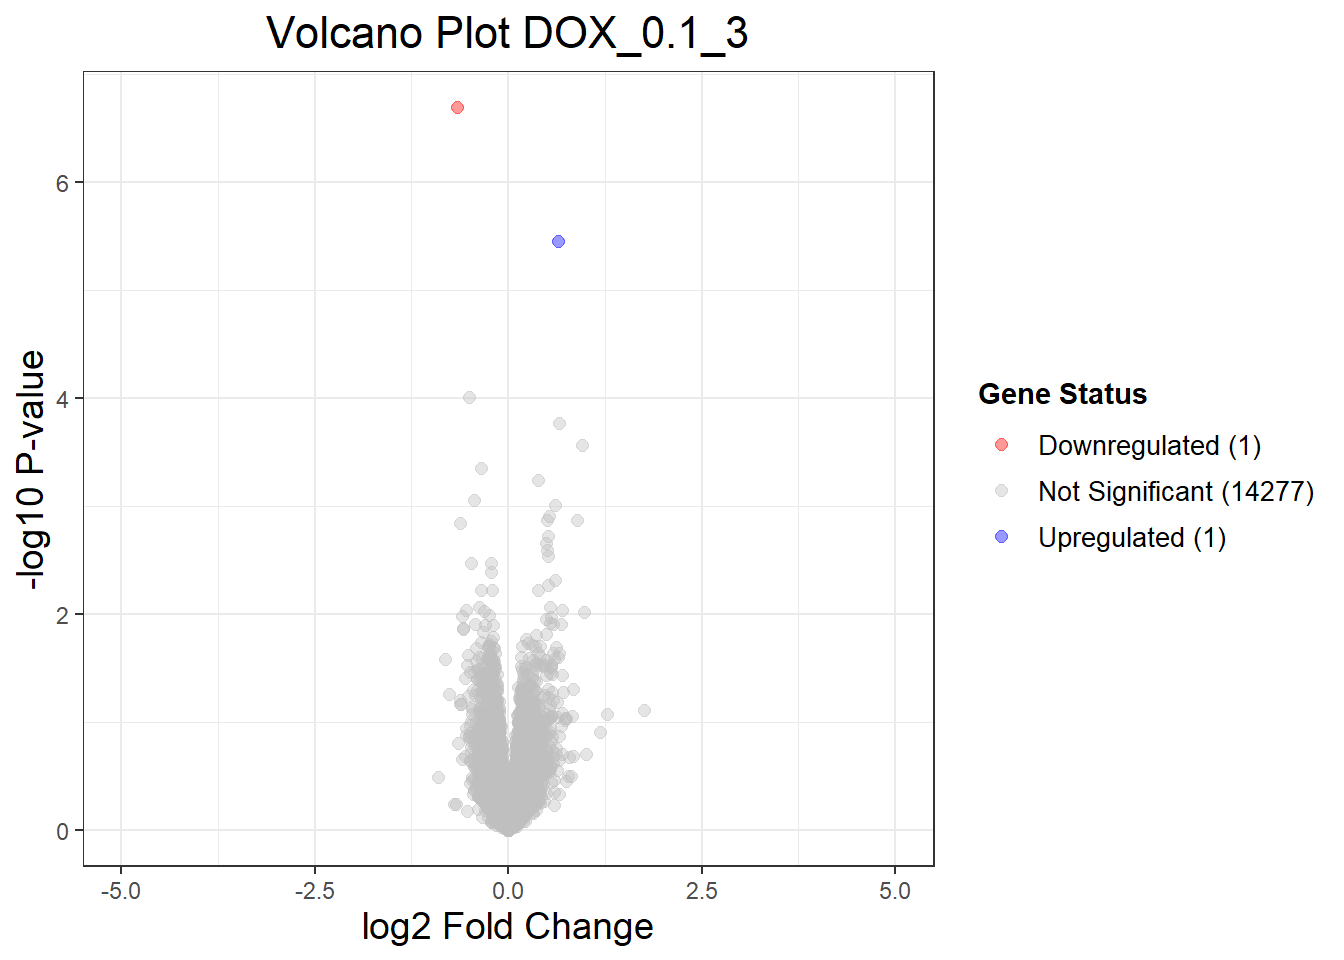
DOX_0.1_3vsVEH_0.1_3 DOX_0.1_24vsVEH_0.1_24 DOX_0.1_48vsVEH_0.1_48
Down 1 2528 1696
NotSig 14277 9215 10818
Up 1 2536 1765
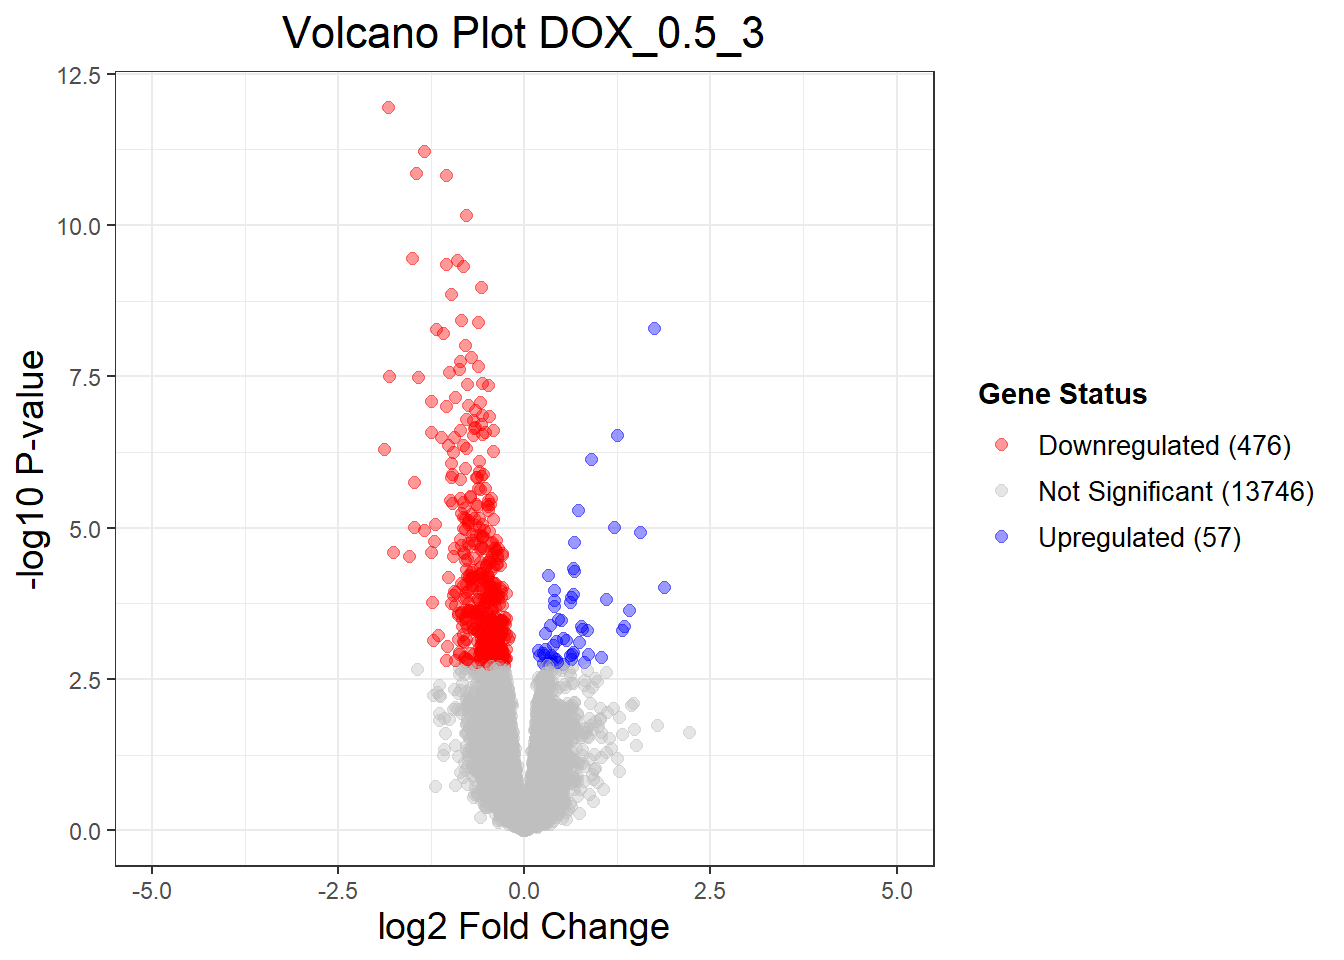
DOX_0.5_3vsVEH_0.5_3 DOX_0.5_24vsVEH_0.5_24 DOX_0.5_48vsVEH_0.5_48
Down 476 5067 5177
NotSig 13746 4451 4151
Up 57 4761 4951📌 Extract Differentially Expressed Genes
# Generate Top Table for Specific Comparisons

Toptable_CX_0.1_3 <- topTable(fit = fit2, coef = "CX_0.1_3vsVEH_0.1_3", number = nrow(x), adjust.method = "BH", p.value = 1, sort.by = "none")

Toptable_CX_0.1_24 <- topTable(fit = fit2, coef = "CX_0.1_24vsVEH_0.1_24", number = nrow(x), adjust.method = "BH", p.value = 1, sort.by = "none")

Toptable_CX_0.1_48 <- topTable(fit = fit2, coef = "CX_0.1_48vsVEH_0.1_48", number = nrow(x), adjust.method = "BH", p.value = 1, sort.by = "none")

Toptable_CX_0.5_3 <- topTable(fit = fit2, coef = "CX_0.5_3vsVEH_0.5_3", number = nrow(x), adjust.method = "BH", p.value = 1, sort.by = "none")

Toptable_CX_0.5_24 <- topTable(fit = fit2, coef = "CX_0.5_24vsVEH_0.5_24", number = nrow(x), adjust.method = "BH", p.value = 1, sort.by = "none")

Toptable_CX_0.5_48 <- topTable(fit = fit2, coef = "CX_0.5_48vsVEH_0.5_48", number = nrow(x), adjust.method = "BH", p.value = 1, sort.by = "none")

Toptable_DOX_0.1_3 <- topTable(fit = fit2, coef = "DOX_0.1_3vsVEH_0.1_3", number = nrow(x), adjust.method = "BH", p.value = 1, sort.by = "none")

Toptable_DOX_0.1_24 <- topTable(fit = fit2, coef = "DOX_0.1_24vsVEH_0.1_24", number = nrow(x), adjust.method = "BH", p.value = 1, sort.by = "none")

Toptable_DOX_0.1_48 <- topTable(fit = fit2, coef = "DOX_0.1_48vsVEH_0.1_48", number = nrow(x), adjust.method = "BH", p.value = 1, sort.by = "none")

Toptable_DOX_0.5_3 <- topTable(fit = fit2, coef = "DOX_0.5_3vsVEH_0.5_3", number = nrow(x), adjust.method = "BH", p.value = 1, sort.by = "none")

Toptable_DOX_0.5_24 <- topTable(fit = fit2, coef = "DOX_0.5_24vsVEH_0.5_24", number = nrow(x), adjust.method = "BH", p.value = 1, sort.by = "none")

Toptable_DOX_0.5_48 <- topTable(fit = fit2, coef = "DOX_0.5_48vsVEH_0.5_48", number = nrow(x), adjust.method = "BH", p.value = 1, sort.by = "none")
📌 Save all Toptables as an RDS file
saveRDS(list(
  CX_0.1_3 = Toptable_CX_0.1_3,
  CX_0.1_24 = Toptable_CX_0.1_24,
  CX_0.1_48 = Toptable_CX_0.1_48,
  CX_0.5_3 = Toptable_CX_0.5_3,
  CX_0.5_24 = Toptable_CX_0.5_24,
  CX_0.5_48 = Toptable_CX_0.5_48,
  DOX_0.1_3 = Toptable_DOX_0.1_3,
  DOX_0.1_24 = Toptable_DOX_0.1_24,
  DOX_0.1_48 = Toptable_DOX_0.1_48,
  DOX_0.5_3 = Toptable_DOX_0.5_3,
  DOX_0.5_24 = Toptable_DOX_0.5_24,
  DOX_0.5_48 = Toptable_DOX_0.5_48
), file = "data/Toptable_list.rds")
📌 Proportion of DEGs
# Load required packages
library(dplyr)
library(tidyr)
library(ggplot2)
# Step 1: Load all DEG files from folder
deg_files <- list.files("data/DEGs/", pattern = "Toptable_.*\\.csv", full.names = TRUE)
# Step 2: Create named list of DEG data frames
deg_list <- lapply(deg_files, read.csv)
names(deg_list) <- gsub("Toptable_|\\.csv", "", basename(deg_files)) # e.g., "CX_0.1_3"
# Step 3: Process each DEG data frame
prop_data <- lapply(names(deg_list), function(name) {
df <- deg_list[[name]]
df <- df %>%
mutate(Category = case_when(
adj.P.Val < 0.05 & logFC > 0 ~ "Upregulated",
adj.P.Val < 0.05 & logFC < 0 ~ "Downregulated",
TRUE ~ "Non-DEGs"
))
df %>%
count(Category) %>%
mutate(Sample = name,
Proportion = 100 * n / sum(n)) %>%
dplyr::select(Sample, Category, Proportion)
}) %>% bind_rows()
# Step 4: Set the correct sample order (by time: 3hr, 24hr, 48hr within each drug-dose)
sample_order <- c(
"CX_0.1_3", "CX_0.1_24", "CX_0.1_48",
"CX_0.5_3", "CX_0.5_24", "CX_0.5_48",
"DOX_0.1_3", "DOX_0.1_24", "DOX_0.1_48",
"DOX_0.5_3", "DOX_0.5_24", "DOX_0.5_48"
)
prop_data$Sample <- factor(prop_data$Sample, levels = sample_order)
prop_data$Category <- factor(prop_data$Category, levels = c("Upregulated", "Downregulated", "Non-DEGs"))
# Step 5: Define fill colors
fill_colors <- c("Upregulated" = "blue", "Downregulated" = "red", "Non-DEGs" = "grey")
# Step 6: Plot the stacked bar chart
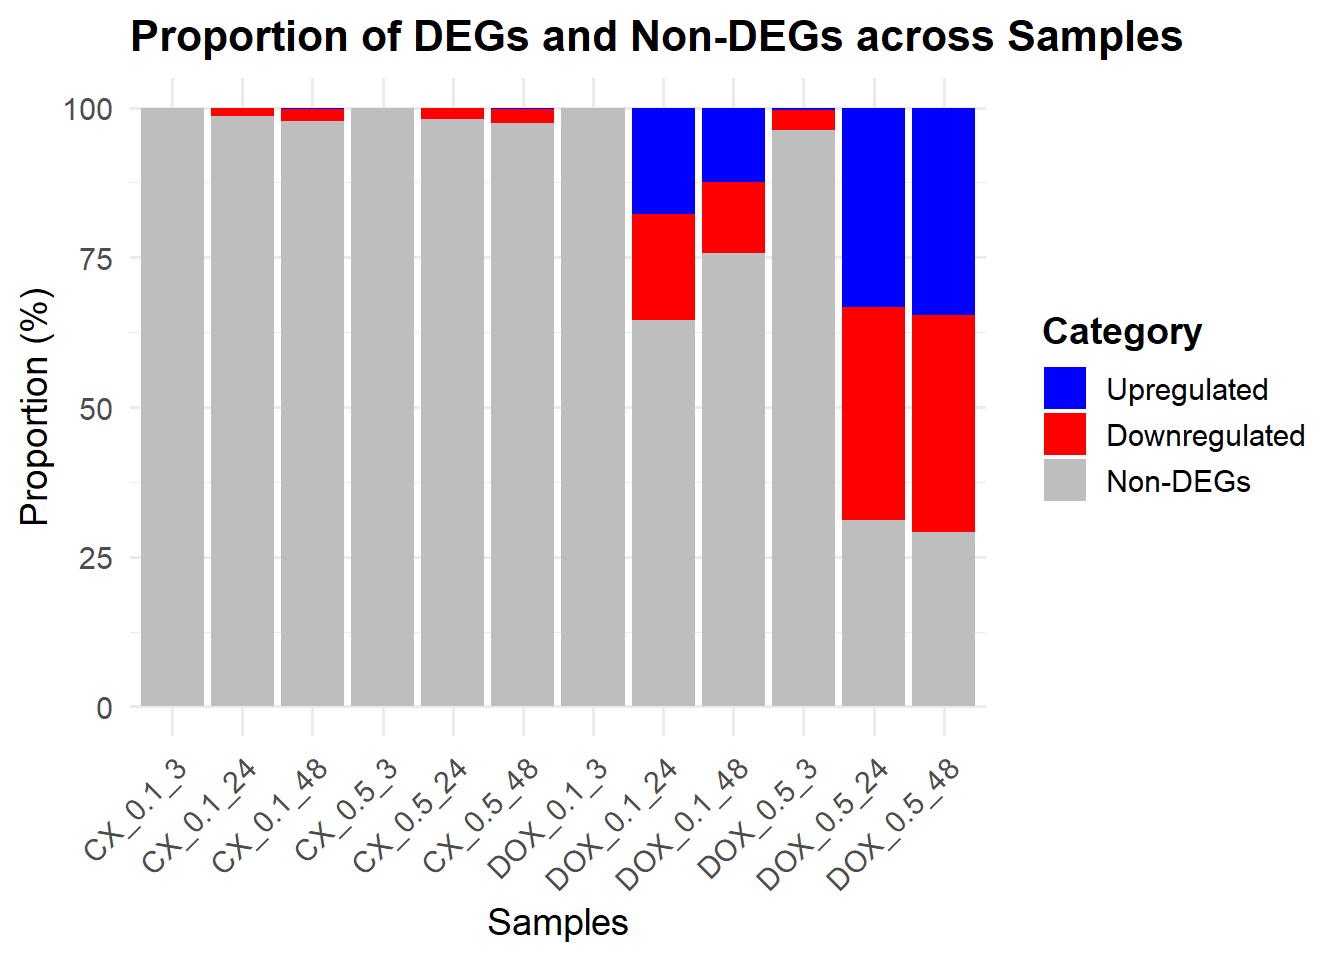
ggplot(prop_data, aes(x = Sample, y = Proportion, fill = Category)) +
geom_bar(stat = "identity") +
scale_fill_manual(values = fill_colors) +
labs(
title = "Proportion of DEGs and Non-DEGs across Samples",
x = "Samples",
y = "Proportion (%)"
) +
theme_minimal(base_size = 14) +
theme(
axis.text.x = element_text(angle = 45, hjust = 1),
plot.title = element_text(size = 16, face = "bold"),
legend.title = element_text(face = "bold")
)
📌 Volcano Plots for Differential Expression Analysis
# Define a function to generate volcano plots
# Define a function to generate volcano plots with count-based legend
generate_volcano_plot <- function(toptable, title) {
# Annotate Significance
toptable$Significance <- "Not Significant"
toptable$Significance[toptable$logFC > 0 & toptable$adj.P.Val < 0.05] <- "Upregulated"
toptable$Significance[toptable$logFC < 0 & toptable$adj.P.Val < 0.05] <- "Downregulated"
# Count per category
count_table <- table(toptable$Significance)
up_count <- count_table["Upregulated"]
down_count <- count_table["Downregulated"]
ns_count <- count_table["Not Significant"]
# Handle NAs
if (is.na(up_count)) up_count <- 0
if (is.na(down_count)) down_count <- 0
if (is.na(ns_count)) ns_count <- 0
# Labels with counts
custom_labels <- c(
paste0("Downregulated (", down_count, ")"),
paste0("Not Significant (", ns_count, ")"),
paste0("Upregulated (", up_count, ")")
)
names(custom_labels) <- c("Downregulated", "Not Significant", "Upregulated")
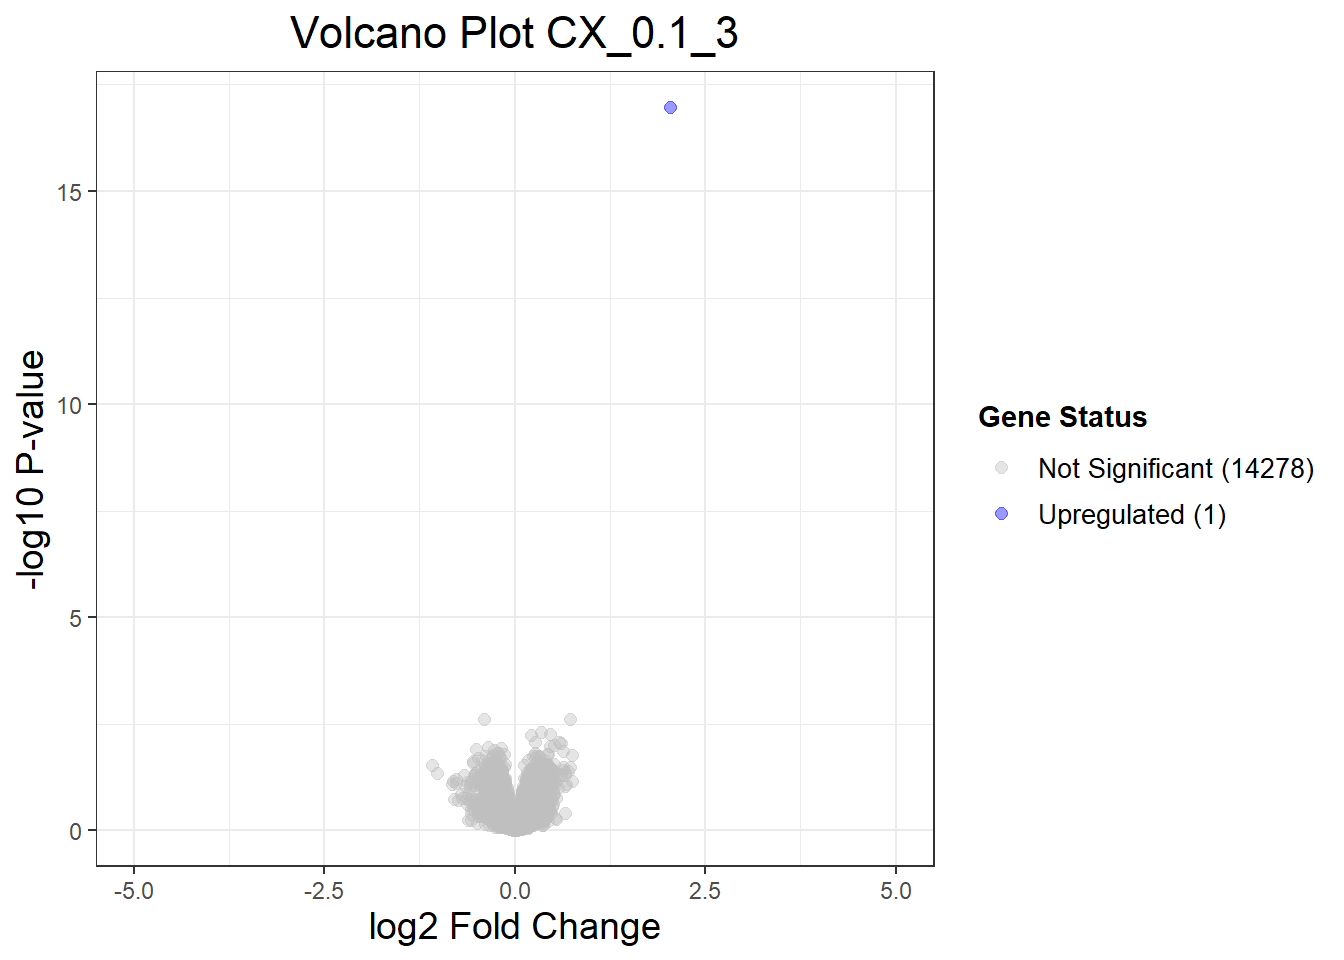
# Volcano plot
ggplot(toptable, aes(x = logFC, y = -log10(P.Value), color = Significance)) +
geom_point(alpha = 0.4, size = 2) +
scale_color_manual(
values = c("Downregulated" = "red", "Upregulated" = "blue", "Not Significant" = "gray"),
labels = custom_labels
) +
xlim(-5, 5) +
labs(
title = title,
x = "log2 Fold Change",
y = "-log10 P-value",
color = "Gene Status"
) +
theme_bw() +
theme(
legend.position = "right",
plot.title = element_text(size = rel(1.5), hjust = 0.5),
axis.title = element_text(size = rel(1.25)),
legend.title = element_text(size = 11, face = "bold"),
legend.text = element_text(size = 10)
)
}
# Generate volcano plots for all comparisons
volcano_plots <- list(
"CX_0.1_3" = generate_volcano_plot(Toptable_CX_0.1_3, "Volcano Plot CX_0.1_3"),
"CX_0.1_24" = generate_volcano_plot(Toptable_CX_0.1_24, "Volcano Plot CX_0.1_24"),
"CX_0.1_48" = generate_volcano_plot(Toptable_CX_0.1_48, "Volcano Plot CX_0.1_48"),
"CX_0.5_3" = generate_volcano_plot(Toptable_CX_0.5_3, "Volcano Plot CX_0.5_3"),
"CX_0.5_24" = generate_volcano_plot(Toptable_CX_0.5_24, "Volcano Plot CX_0.5_24"),
"CX_0.5_48" = generate_volcano_plot(Toptable_CX_0.5_48, "Volcano Plot CX_0.5_48"),
"DOX_0.1_3" = generate_volcano_plot(Toptable_DOX_0.1_3, "Volcano Plot DOX_0.1_3"),
"DOX_0.1_24" = generate_volcano_plot(Toptable_DOX_0.1_24, "Volcano Plot DOX_0.1_24"),
"DOX_0.1_48" = generate_volcano_plot(Toptable_DOX_0.1_48, "Volcano Plot DOX_0.1_48"),
"DOX_0.5_3" = generate_volcano_plot(Toptable_DOX_0.5_3, "Volcano Plot DOX_0.5_3"),
"DOX_0.5_24" = generate_volcano_plot(Toptable_DOX_0.5_24, "Volcano Plot DOX_0.5_24"),
"DOX_0.5_48" = generate_volcano_plot(Toptable_DOX_0.5_48, "Volcano Plot DOX_0.5_48")
)
# Display plots
for (plot_name in names(volcano_plots)) {
print(volcano_plots[[plot_name]])
}
Warning: Removed 3 rows containing missing values or values outside the scale range
(`geom_point()`).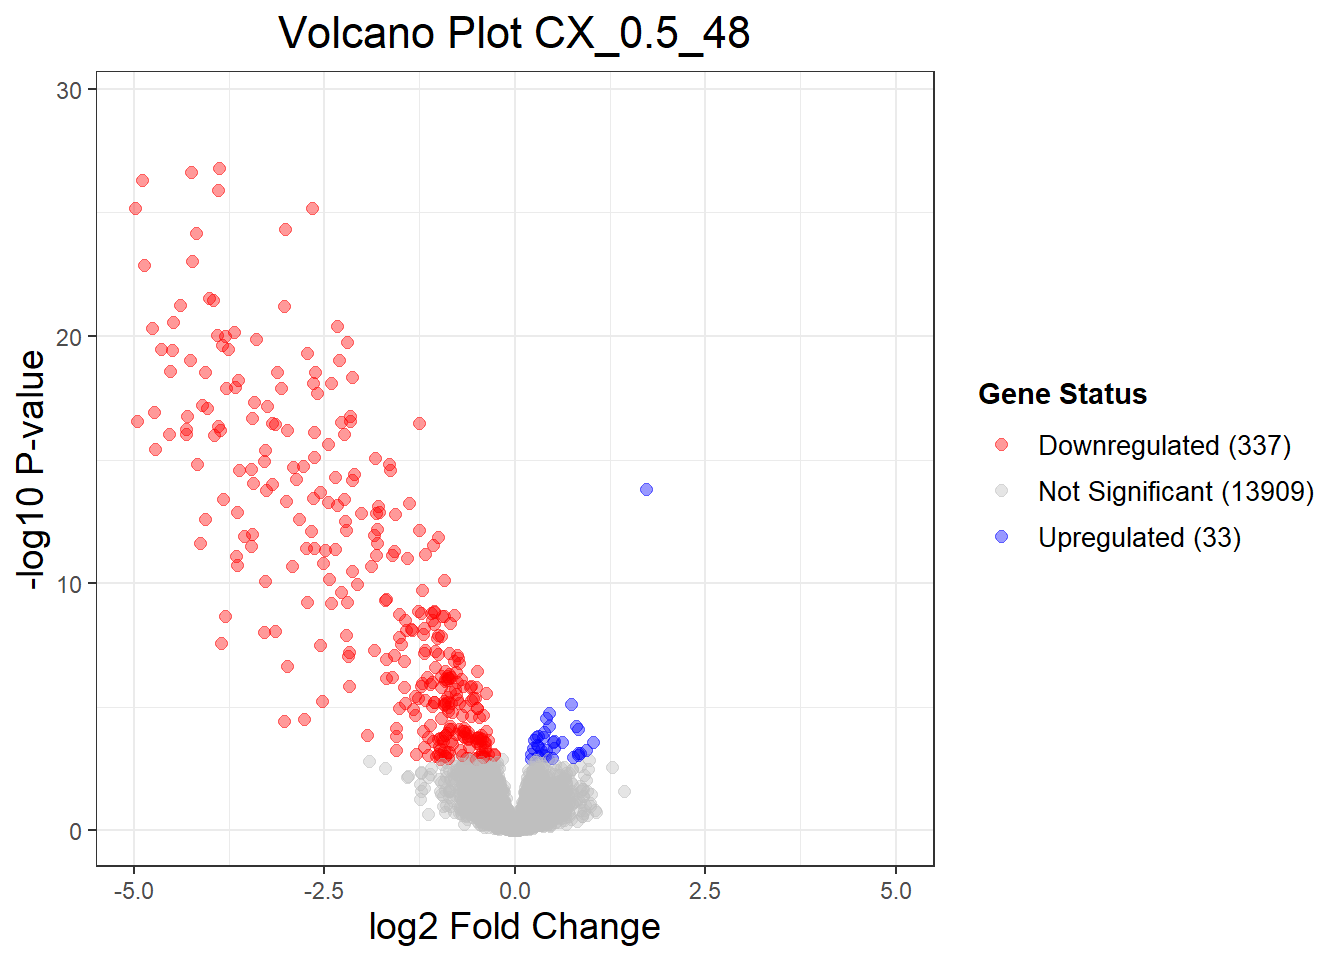
Warning: Removed 1 row containing missing values or values outside the scale range
(`geom_point()`).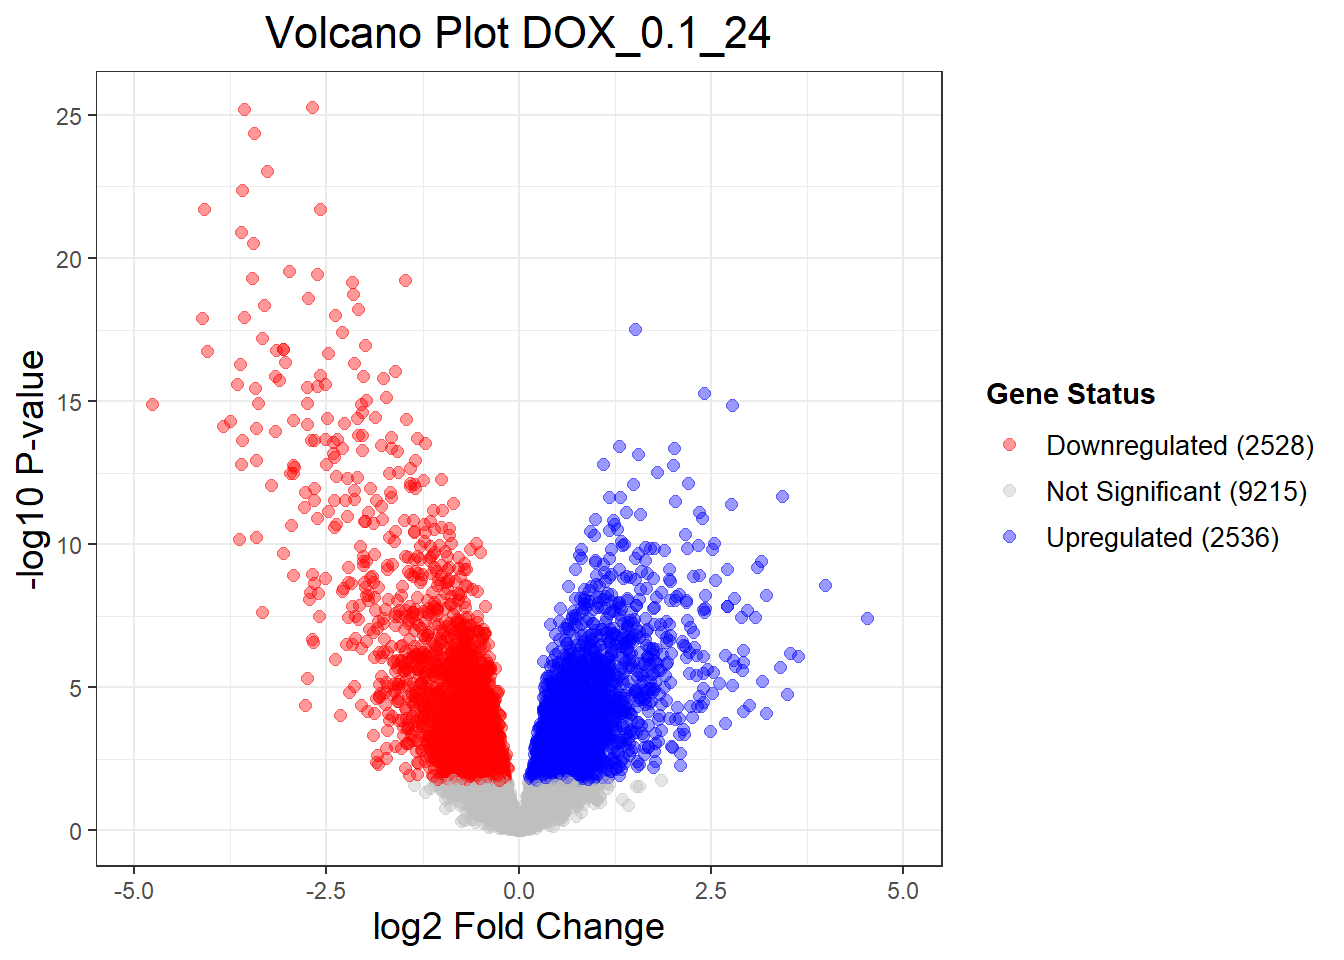
Warning: Removed 34 rows containing missing values or values outside the scale range
(`geom_point()`).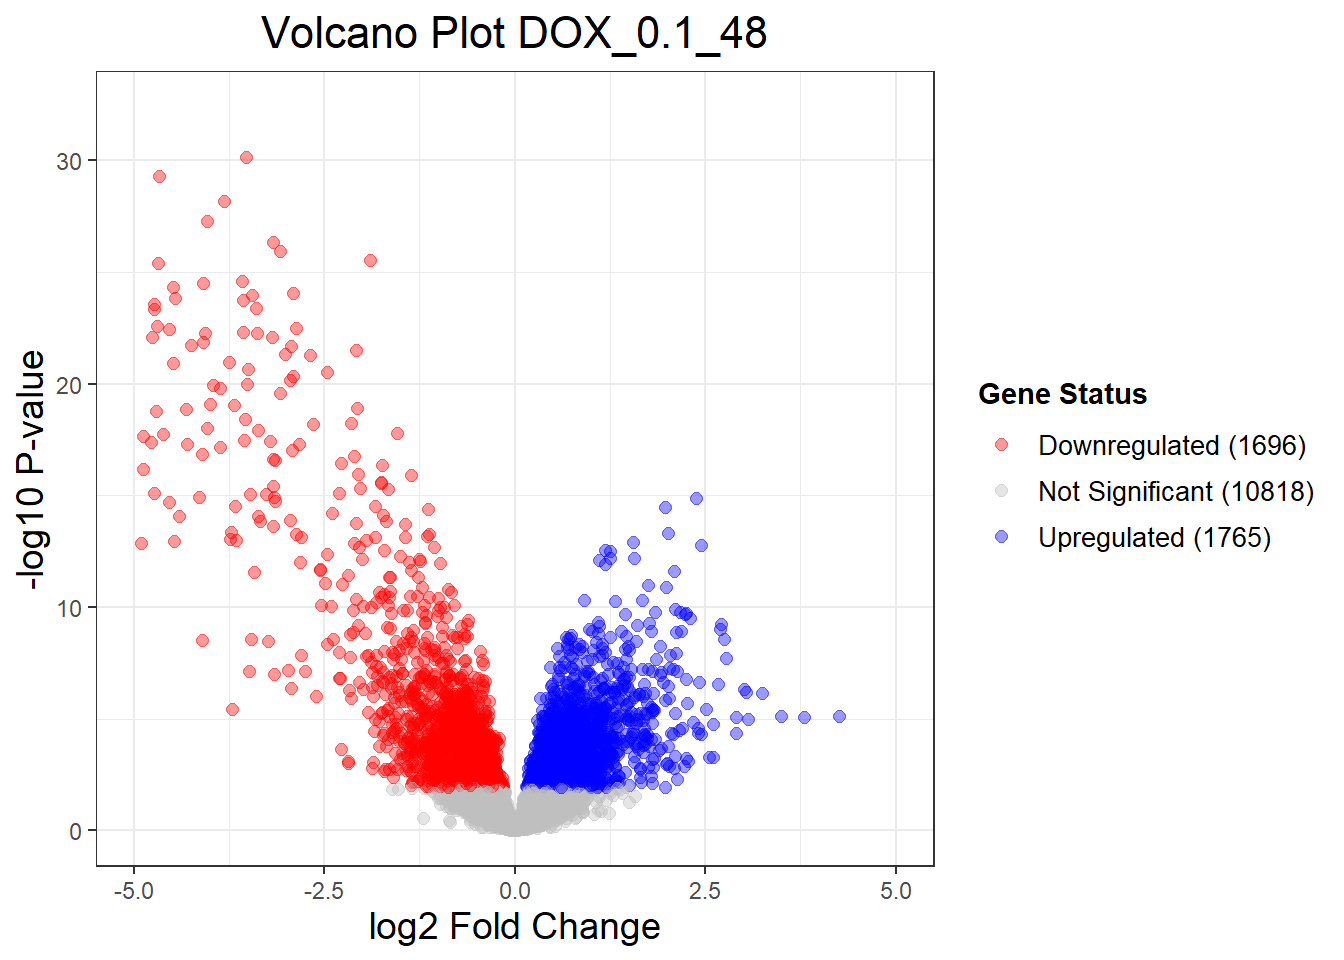
Warning: Removed 28 rows containing missing values or values outside the scale range
(`geom_point()`).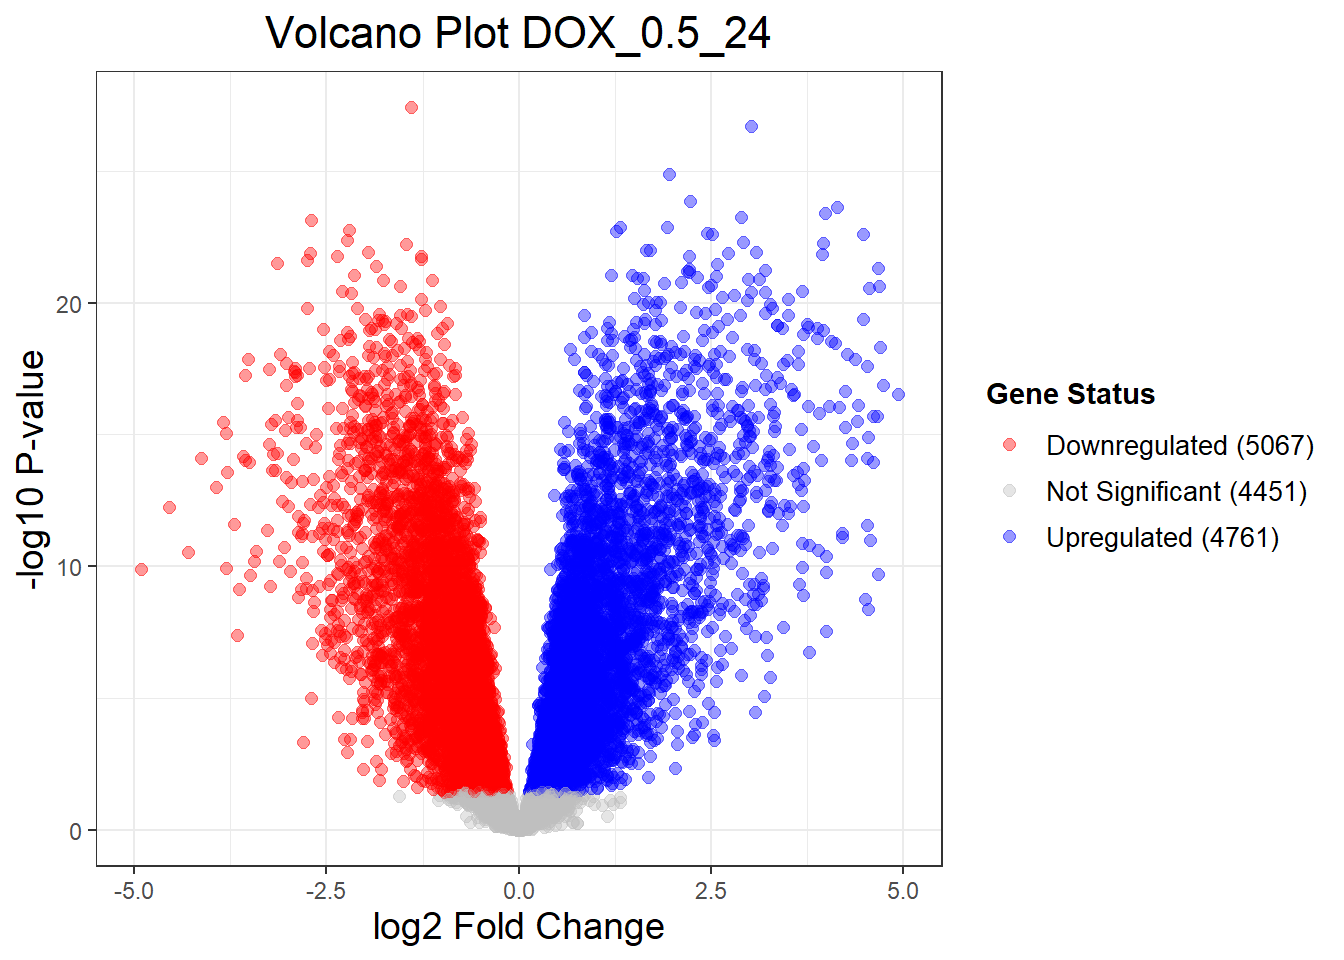
Warning: Removed 24 rows containing missing values or values outside the scale range
(`geom_point()`).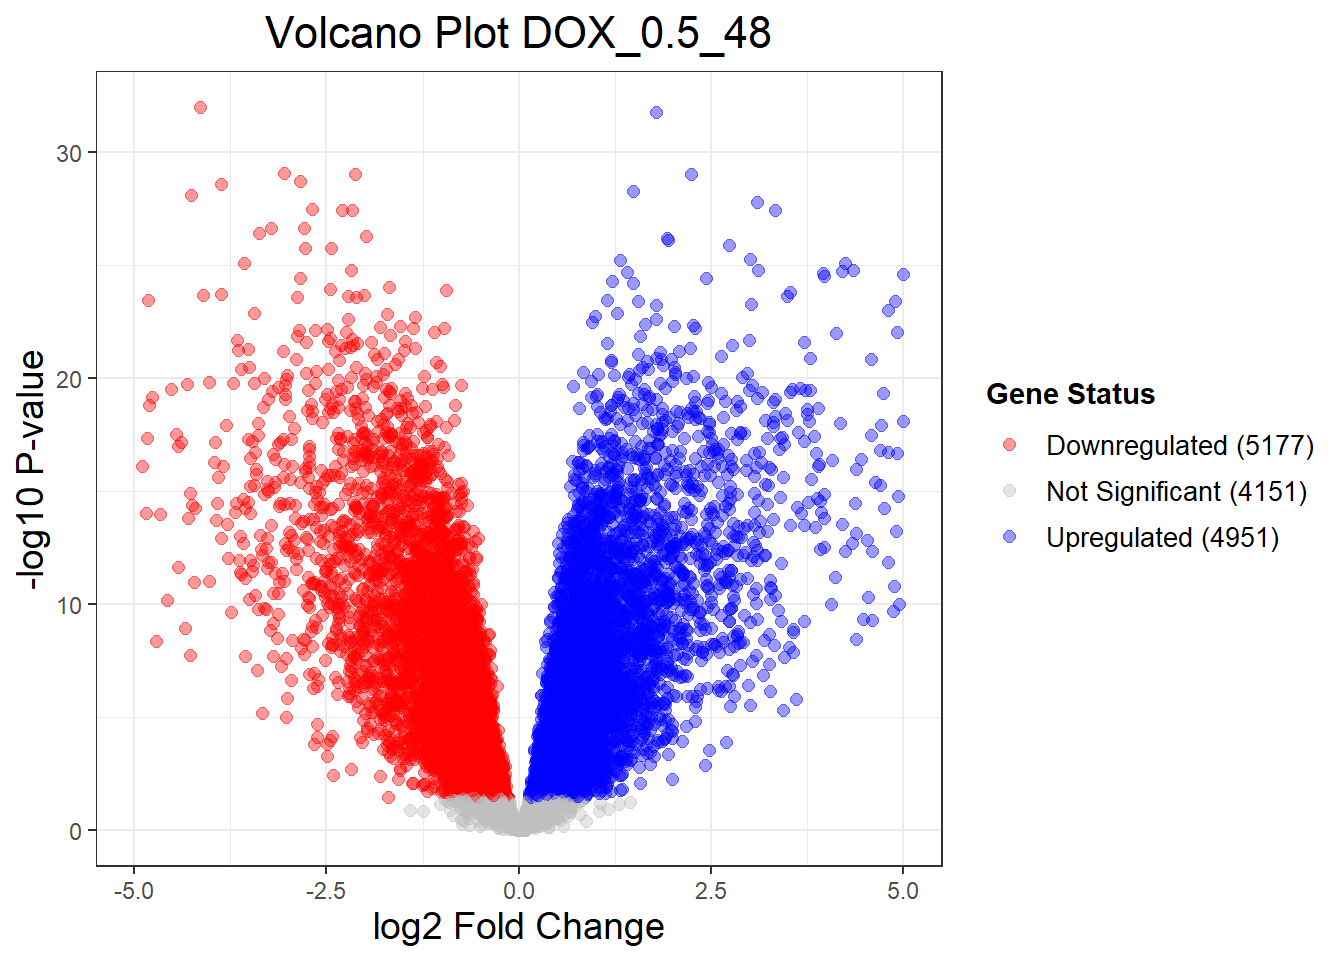
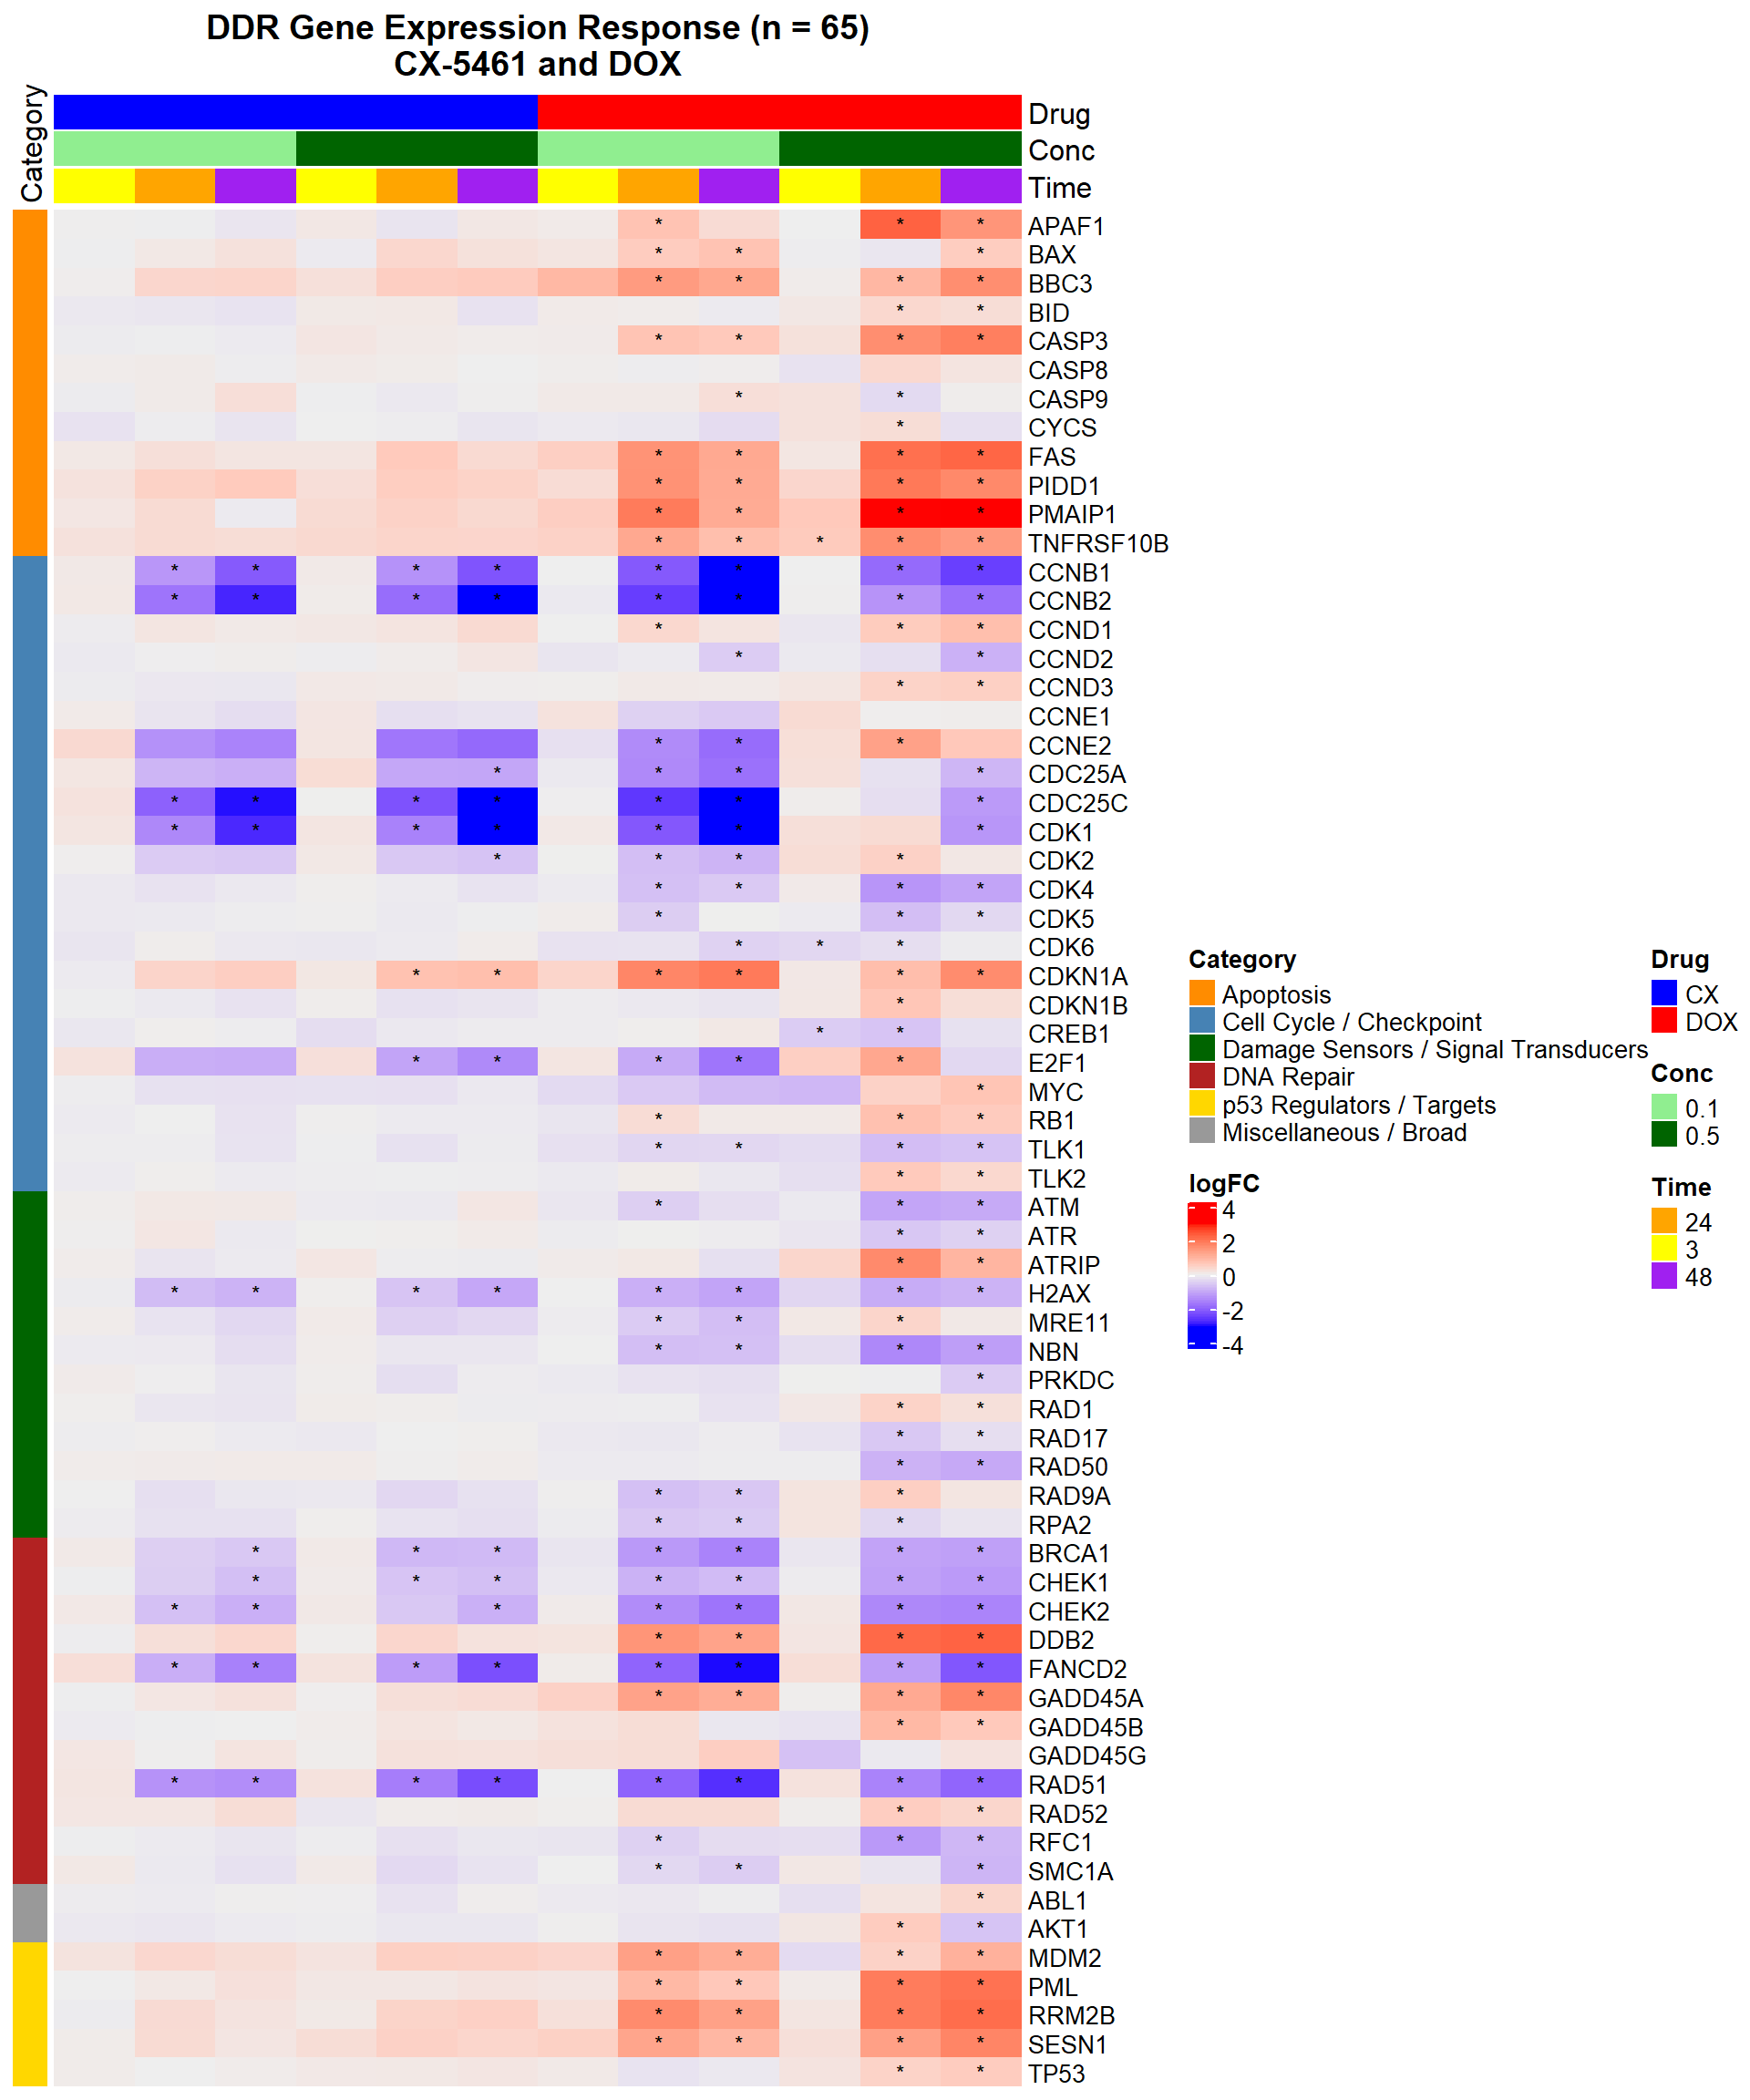
📌 DNA Damage Marker expression changes between CX5461 and DOX
# 📌 DDR Gene Expression Heatmap — CX-5461 and DOX (68 genes, with categories)

# 📦 Load Required Libraries
library(tidyverse)
library(ComplexHeatmap)
library(circlize)
library(grid)
library(org.Hs.eg.db)
library(reshape2)

# 📁 Load DEG files
load_deg <- function(path) read.csv(path)

CX_0.1_3 <- load_deg("data/DEGs/Toptable_CX_0.1_3.csv")
CX_0.1_24 <- load_deg("data/DEGs/Toptable_CX_0.1_24.csv")
CX_0.1_48 <- load_deg("data/DEGs/Toptable_CX_0.1_48.csv")
CX_0.5_3 <- load_deg("data/DEGs/Toptable_CX_0.5_3.csv")
CX_0.5_24 <- load_deg("data/DEGs/Toptable_CX_0.5_24.csv")
CX_0.5_48 <- load_deg("data/DEGs/Toptable_CX_0.5_48.csv")
DOX_0.1_3 <- load_deg("data/DEGs/Toptable_DOX_0.1_3.csv")
DOX_0.1_24 <- load_deg("data/DEGs/Toptable_DOX_0.1_24.csv")
DOX_0.1_48 <- load_deg("data/DEGs/Toptable_DOX_0.1_48.csv")
DOX_0.5_3 <- load_deg("data/DEGs/Toptable_DOX_0.5_3.csv")
DOX_0.5_24 <- load_deg("data/DEGs/Toptable_DOX_0.5_24.csv")
DOX_0.5_48 <- load_deg("data/DEGs/Toptable_DOX_0.5_48.csv")

# 📌 Define Entrez IDs and Categories (excluding DOX Cardiotoxicity genes)
entrez_category <- tribble(
  ~ENTREZID, ~Category,
  317, "Apoptosis", 355, "Apoptosis", 581, "Apoptosis", 637, "Apoptosis",
  836, "Apoptosis", 841, "Apoptosis", 842, "Apoptosis", 27113, "Apoptosis",
  5366, "Apoptosis", 54205, "Apoptosis", 55367, "Apoptosis", 8795, "Apoptosis",
  1026, "Cell Cycle / Checkpoint", 1027, "Cell Cycle / Checkpoint", 595, "Cell Cycle / Checkpoint",
  894, "Cell Cycle / Checkpoint", 896, "Cell Cycle / Checkpoint", 898, "Cell Cycle / Checkpoint",
  9133, "Cell Cycle / Checkpoint", 9134, "Cell Cycle / Checkpoint", 891, "Cell Cycle / Checkpoint",
  983, "Cell Cycle / Checkpoint", 1017, "Cell Cycle / Checkpoint", 1019, "Cell Cycle / Checkpoint",
  1020, "Cell Cycle / Checkpoint", 1021, "Cell Cycle / Checkpoint", 993, "Cell Cycle / Checkpoint",
  995, "Cell Cycle / Checkpoint", 1869, "Cell Cycle / Checkpoint", 4609, "Cell Cycle / Checkpoint",
  5925, "Cell Cycle / Checkpoint", 9874, "Cell Cycle / Checkpoint", 11011, "Cell Cycle / Checkpoint",
  1385, "Cell Cycle / Checkpoint",
  472, "Damage Sensors / Signal Transducers", 545, "Damage Sensors / Signal Transducers",
  5591, "Damage Sensors / Signal Transducers", 5810, "Damage Sensors / Signal Transducers",
  5883, "Damage Sensors / Signal Transducers", 5884, "Damage Sensors / Signal Transducers",
  6118, "Damage Sensors / Signal Transducers", 4361, "Damage Sensors / Signal Transducers",
  10111, "Damage Sensors / Signal Transducers", 4683, "Damage Sensors / Signal Transducers",
  84126, "Damage Sensors / Signal Transducers", 3014, "Damage Sensors / Signal Transducers",
  672, "DNA Repair", 2177, "DNA Repair", 5888, "DNA Repair", 5893, "DNA Repair",
  1647, "DNA Repair", 4616, "DNA Repair", 10912, "DNA Repair", 1111, "DNA Repair",
  11200, "DNA Repair", 1643, "DNA Repair", 8243, "DNA Repair", 5981, "DNA Repair",
  7157, "p53 Regulators / Targets", 4193, "p53 Regulators / Targets", 5371, "p53 Regulators / Targets",
  27244, "p53 Regulators / Targets", 50484, "p53 Regulators / Targets",
  207, "Miscellaneous / Broad", 25, "Miscellaneous / Broad"
)

entrez_ids <- entrez_category$ENTREZID

# 📌 Extract Data Function
extract_data <- function(df, name) {
  df %>%
    filter(Entrez_ID %in% entrez_ids) %>%
    mutate(
      Gene = mapIds(org.Hs.eg.db, as.character(Entrez_ID),
                    column = "SYMBOL", keytype = "ENTREZID", multiVals = "first"),
      Condition = name,
      Signif = ifelse(adj.P.Val < 0.05, "*", "")
    )
}

# 📁 DEG list
deg_list <- list(
  "CX_0.1_3" = CX_0.1_3, "CX_0.1_24" = CX_0.1_24, "CX_0.1_48" = CX_0.1_48,
  "CX_0.5_3" = CX_0.5_3, "CX_0.5_24" = CX_0.5_24, "CX_0.5_48" = CX_0.5_48,
  "DOX_0.1_3" = DOX_0.1_3, "DOX_0.1_24" = DOX_0.1_24, "DOX_0.1_48" = DOX_0.1_48,
  "DOX_0.5_3" = DOX_0.5_3, "DOX_0.5_24" = DOX_0.5_24, "DOX_0.5_48" = DOX_0.5_48
)

# 🔗 Combine and Annotate
all_data <- bind_rows(mapply(extract_data, deg_list, names(deg_list), SIMPLIFY = FALSE)) %>%
  left_join(entrez_category, by = c("Entrez_ID" = "ENTREZID"))

# 🔢 Create matrices
logFC_mat <- acast(all_data, Gene ~ Condition, value.var = "logFC")
signif_mat <- acast(all_data, Gene ~ Condition, value.var = "Signif")

# 🧱 Set column order
desired_order <- c("CX_0.1_3", "CX_0.1_24", "CX_0.1_48",
                   "CX_0.5_3", "CX_0.5_24", "CX_0.5_48",
                   "DOX_0.1_3", "DOX_0.1_24", "DOX_0.1_48",
                   "DOX_0.5_3", "DOX_0.5_24", "DOX_0.5_48")

logFC_mat <- logFC_mat[, desired_order, drop = FALSE]
signif_mat <- signif_mat[, desired_order, drop = FALSE]

# 🏷️ Column annotations
meta <- str_split_fixed(colnames(logFC_mat), "_", 3)
col_annot <- HeatmapAnnotation(
  Drug = meta[, 1],
  Conc = meta[, 2],
  Time = meta[, 3],
  col = list(
    Drug = c("CX" = "blue", "DOX" = "red"),
    Conc = c("0.1" = "lightgreen", "0.5" = "darkgreen"),
    Time = c("3" = "yellow", "24" = "orange", "48" = "purple")
  ),
  annotation_height = unit(c(1, 1, 1), "cm")
)

# 🧬 Row annotations
gene_order_df <- all_data %>%
  distinct(Gene, Category) %>%
  arrange(factor(Category, levels = sort(unique(entrez_category$Category))), Gene)

ordered_genes <- gene_order_df$Gene
logFC_mat <- logFC_mat[ordered_genes, ]
signif_mat <- signif_mat[ordered_genes, ]

# 🎨 Category color mapping
category_colors_named <- c(
  "Apoptosis" = "darkorange",
  "Cell Cycle / Checkpoint" = "steelblue",
  "Damage Sensors / Signal Transducers" = "darkgreen",
  "DNA Repair" = "firebrick",
  "p53 Regulators / Targets" = "gold",
  "Miscellaneous / Broad" = "gray60"
)

gene_order_df$Category <- factor(gene_order_df$Category, levels = names(category_colors_named))

ha_left <- rowAnnotation(
  Category = gene_order_df$Category,
  col = list(Category = category_colors_named),
  annotation_name_side = "top"
)

# 📊 Final Heatmap
Heatmap(logFC_mat,
        name = "logFC",
        top_annotation = col_annot,
        left_annotation = ha_left,
        cluster_columns = FALSE,
        cluster_rows = FALSE,
        show_row_names = TRUE,
        show_column_names = FALSE,
        row_names_gp = gpar(fontsize = 10),
        column_title = "DDR Gene Expression Response (n = 65)\nCX-5461 and DOX",
        column_title_gp = gpar(fontsize = 14, fontface = "bold"),
        cell_fun = function(j, i, x, y, width, height, fill) {
          grid.text(signif_mat[i, j], x, y, gp = gpar(fontsize = 9))
        }
)
📌 LogFC boxplots of DNA Damage Response Genes
# Load Libraries
library(tidyverse)
library(org.Hs.eg.db)

# DEG File Paths
deg_files <- list(
  "CX_0.1_3" = "data/DEGs/Toptable_CX_0.1_3.csv",
  "CX_0.1_24" = "data/DEGs/Toptable_CX_0.1_24.csv",
  "CX_0.1_48" = "data/DEGs/Toptable_CX_0.1_48.csv",
  "CX_0.5_3" = "data/DEGs/Toptable_CX_0.5_3.csv",
  "CX_0.5_24" = "data/DEGs/Toptable_CX_0.5_24.csv",
  "CX_0.5_48" = "data/DEGs/Toptable_CX_0.5_48.csv",
  "DOX_0.1_3" = "data/DEGs/Toptable_DOX_0.1_3.csv",
  "DOX_0.1_24" = "data/DEGs/Toptable_DOX_0.1_24.csv",
  "DOX_0.1_48" = "data/DEGs/Toptable_DOX_0.1_48.csv",
  "DOX_0.5_3" = "data/DEGs/Toptable_DOX_0.5_3.csv",
  "DOX_0.5_24" = "data/DEGs/Toptable_DOX_0.5_24.csv",
  "DOX_0.5_48" = "data/DEGs/Toptable_DOX_0.5_48.csv"
)

# DDR Entrez IDs
entrez_ids <- c(
  10111, 1017, 1019, 1020, 1021, 1026, 1027, 10912, 11011, 1111,
  11200, 1385, 1643, 1647, 1869, 207, 2177, 25, 27113, 27244,
  3014, 317, 355, 4193, 4292, 4361, 4609, 4616, 4683, 472, 50484,
  5366, 5371, 54205, 545, 55367, 5591, 581, 5810, 5883, 5884,
  5888, 5893, 5925, 595, 5981, 6118, 637, 672, 7157, 7799,
  8243, 836, 841, 84126, 842, 8795, 891, 894, 896, 898,
  9133, 9134, 983, 9874, 993, 995, 5916
) %>% as.character()

# Load and Filter DEGs
ddr_data_list <- map2_dfr(deg_files, names(deg_files), function(file, label) {
  read_csv(file, show_col_types = FALSE) %>%
    mutate(
      Entrez_ID = as.character(Entrez_ID),
      Condition = label,
      Drug = ifelse(str_detect(label, "CX"), "CX.5461", "DOX")
    ) %>%
    filter(Entrez_ID %in% entrez_ids)
})

# Complete Combinations
all_conditions <- names(deg_files)
all_combos <- crossing(
  Entrez_ID = entrez_ids,
  Condition = all_conditions
) %>%
  mutate(
    Drug = ifelse(str_detect(Condition, "CX"), "CX.5461", "DOX")
  )

# Merge with DEG Data
complete_ddr <- all_combos %>%
  left_join(ddr_data_list, by = c("Entrez_ID", "Condition", "Drug")) %>%
  mutate(
    logFC = ifelse(is.na(logFC), 0, logFC),
    adj.P.Val = ifelse(is.na(adj.P.Val), 1, adj.P.Val)
  )

#Map Gene Symbols
complete_ddr <- complete_ddr %>%
  mutate(
    Gene = mapIds(org.Hs.eg.db, keys = Entrez_ID,
                  column = "SYMBOL", keytype = "ENTREZID", multiVals = "first")
  )

# Order Condition Labels
complete_ddr$Condition <- factor(complete_ddr$Condition, levels = c(
  "CX_0.1_3", "CX_0.1_24", "CX_0.1_48",
  "CX_0.5_3", "CX_0.5_24", "CX_0.5_48",
  "DOX_0.1_3", "DOX_0.1_24", "DOX_0.1_48",
  "DOX_0.5_3", "DOX_0.5_24", "DOX_0.5_48"
))

#Wilcoxon Test: CX vs DOX Per Condition

condition_pairs <- tibble(
  cx = c("CX_0.1_3", "CX_0.1_24", "CX_0.1_48", "CX_0.5_3", "CX_0.5_24", "CX_0.5_48"),
  dox = c("DOX_0.1_3", "DOX_0.1_24", "DOX_0.1_48", "DOX_0.5_3", "DOX_0.5_24", "DOX_0.5_48")
)

wilcox_results <- map2_dfr(condition_pairs$cx, condition_pairs$dox, function(cx_label, dox_label) {
  cx_vals <- complete_ddr %>% filter(Condition == cx_label) %>% pull(logFC)
  dox_vals <- complete_ddr %>% filter(Condition == dox_label) %>% pull(logFC)

  test <- tryCatch(wilcox.test(cx_vals, dox_vals), error = function(e) NULL)
  pval <- if (!is.null(test)) test$p.value else NA

  tibble(
    Condition = dox_label,
    p_value = signif(pval, 3),
    label = case_when(
      pval < 0.001 ~ "***",
      pval < 0.01  ~ "**",
      pval < 0.05  ~ "*",
      TRUE         ~ ""
    ),
    y_pos = max(c(cx_vals, dox_vals), na.rm = TRUE) + 0.5
  )
})

# Final Boxplot
ggplot(complete_ddr, aes(x = Condition, y = logFC, fill = Drug)) +
  geom_boxplot(outlier.size = 0.6) +
  geom_text(data = wilcox_results,
            aes(x = Condition, y = y_pos, label = label),
            inherit.aes = FALSE,
            size = 4, vjust = 0) +
  scale_fill_manual(values = c("CX.5461" = "blue", "DOX" = "red")) +
  labs(
    title = "LogFC of DNA Damage Response Genes",
    x = "Condition",
    y = "logFC",
    fill = "Drug"
  ) +
  theme_bw(base_size = 14) +
  theme(
    plot.title = element_text(size = rel(1.5), hjust = 0.5),
    axis.title = element_text(size = 14),
    axis.text.x = element_text(angle = 45, hjust = 1, size = 10),
    legend.title = element_text(size = 14),
    legend.text = element_text(size = 12)
  )
📌 P53 target gene expression changes between CX5461 and DOX
# Load libraries
library(tidyverse)
library(ComplexHeatmap)
library(circlize)
library(grid)
library(org.Hs.eg.db)
library(reshape2)

# Load DEG files
load_deg <- function(path) read.csv(path)

CX_0.1_3 <- load_deg("data/DEGs/Toptable_CX_0.1_3.csv")
CX_0.1_24 <- load_deg("data/DEGs/Toptable_CX_0.1_24.csv")
CX_0.1_48 <- load_deg("data/DEGs/Toptable_CX_0.1_48.csv")
CX_0.5_3 <- load_deg("data/DEGs/Toptable_CX_0.5_3.csv")
CX_0.5_24 <- load_deg("data/DEGs/Toptable_CX_0.5_24.csv")
CX_0.5_48 <- load_deg("data/DEGs/Toptable_CX_0.5_48.csv")
DOX_0.1_3 <- load_deg("data/DEGs/Toptable_DOX_0.1_3.csv")
DOX_0.1_24 <- load_deg("data/DEGs/Toptable_DOX_0.1_24.csv")
DOX_0.1_48 <- load_deg("data/DEGs/Toptable_DOX_0.1_48.csv")
DOX_0.5_3 <- load_deg("data/DEGs/Toptable_DOX_0.5_3.csv")
DOX_0.5_24 <- load_deg("data/DEGs/Toptable_DOX_0.5_24.csv")
DOX_0.5_48 <- load_deg("data/DEGs/Toptable_DOX_0.5_48.csv")

# P53 target Entrez IDs (shortened for clarity – replace with your full list)
entrez_ids <- c(1026,50484,4193,9766,9518,7832,1643,1647,1263,57103,51065,8795,51499,64393,581,
                5228,5429,8493,55959,7508,64782,282991,355,53836,4814,10769,9050,27244,9540,94241,
                26154,57763,900,26999,55332,26263,23479,23612,29950,9618,10346,8824,134147,55294,
                22824,4254,6560,467,27113,60492,8444,60401,1969,220965,2232,3976,55191,84284,93129,
                5564,7803,83667,7779,132671,7039,51768,137695,93134,7633,10973,340485,307,27350,
                23245,3732,29965,1363,1435,196513,8507,8061,2517,51278,53354,54858,23228,5366,5912,
                6236,51222,26152,59,1907,50650,91012,780,9249,11072,144455,64787,116151,27165,2876,
                57822,55733,57722,121457,375449,85377,4851,5875,127544,29901,84958,8797,8793,441631,
                220001,54541,5889,5054,25816,25987,5111,98,317,598,604,10904,1294,80315,53944,
                1606,2770,3628,3675,3985,4035,4163,84552,29085,55367,5371,5791,54884,5980,8794,
                1462,50808,220,583,694,1056,9076,10978,54677,1612,55040,114907,2274,127707,4000,
                8079,4646,4747,27445,5143,80055,79156,5360,5364,23654,5565,5613,5625,10076,56963,
                6004,390,255488,6326,6330,23513,7869,283130,204962,83959,6548,6774,9263,10228,
                22954,10475,85363,494514,10142,79714,1006,8446,9648,79828,5507,55240,63874,25841,
                9289,84883,154810,51321,421,8553,655,119032,84280,10950,824,839,57828,857,8812,
                8837,94027,113189,22837,132864,10898,3300,81704,1847,1849,1947,9538,24139,5168,
                147965,115548,9873,23768,2632,2817,3280,3265,23308,3490,51477,182,3856,8844,144811,
                9404,4043,9848,2872,23041,740,343263,4638,26509,4792,22861,57523,55214,80025,164091,
                57060,64065,51090,5453,8496,333926,55671,5900,55544,23179,8601,389,6223,55800,6385,
                4088,6643,122809,257397,285343,7011,54790,374618,55362,51754,7157,9537,22906,7205,
                80705,219699,55245,83719,7748,25946,118738)

# Function to extract relevant data
extract_data <- function(df, name) {
  df %>%
    filter(Entrez_ID %in% entrez_ids) %>%
    mutate(Gene = mapIds(org.Hs.eg.db, as.character(Entrez_ID),
                         column = "SYMBOL", keytype = "ENTREZID", multiVals = "first"),
           Condition = name,
           Signif = ifelse(adj.P.Val < 0.05, "*", ""))
}

# Collect all data
deg_list <- list(
  "CX_0.1_3" = CX_0.1_3, "CX_0.1_24" = CX_0.1_24, "CX_0.1_48" = CX_0.1_48,
  "CX_0.5_3" = CX_0.5_3, "CX_0.5_24" = CX_0.5_24, "CX_0.5_48" = CX_0.5_48,
  "DOX_0.1_3" = DOX_0.1_3, "DOX_0.1_24" = DOX_0.1_24, "DOX_0.1_48" = DOX_0.1_48,
  "DOX_0.5_3" = DOX_0.5_3, "DOX_0.5_24" = DOX_0.5_24, "DOX_0.5_48" = DOX_0.5_48
)

all_data <- bind_rows(mapply(extract_data, deg_list, names(deg_list), SIMPLIFY = FALSE))

# Create matrices
logFC_mat <- acast(all_data, Gene ~ Condition, value.var = "logFC")
signif_mat <- acast(all_data, Gene ~ Condition, value.var = "Signif")

# Desired column order
desired_order <- c("CX_0.1_3", "CX_0.1_24", "CX_0.1_48",
                   "CX_0.5_3", "CX_0.5_24", "CX_0.5_48",
                   "DOX_0.1_3", "DOX_0.1_24", "DOX_0.1_48",
                   "DOX_0.5_3", "DOX_0.5_24", "DOX_0.5_48")

logFC_mat <- logFC_mat[, desired_order]
signif_mat <- signif_mat[, desired_order]

# Column annotation
meta <- str_split_fixed(colnames(logFC_mat), "_", 3)
col_annot <- HeatmapAnnotation(
  Drug = meta[, 1],
  Conc = meta[, 2],
  Time = meta[, 3],
  col = list(
    Drug = c("CX" = "blue", "DOX" = "red"),
    Conc = c("0.1" = "lightgreen", "0.5" = "darkgreen"),
    Time = c("3" = "yellow", "24" = "orange", "48" = "purple")
  ),
  annotation_height = unit(c(2, 2, 2), "cm")
)

# Draw heatmap
Heatmap(logFC_mat,
        name = "logFC",
        top_annotation = col_annot,
        cluster_columns = FALSE,
        cluster_rows = TRUE,
        show_row_names = TRUE,
        show_column_names = FALSE,
        cell_fun = function(j, i, x, y, width, height, fill) {
          grid.text(signif_mat[i, j], x, y, gp = gpar(fontsize = 9))
        },
        column_title = "P53 Target Genes\nCX-5461 and DOX Expression",
        column_title_gp = gpar(fontsize = 14, fontface = "bold")
)
| Version | Author | Date |
|---|---|---|
| 92099e7 | sayanpaul01 | 2025-05-08 |
📌 LogFC boxplots of P53 target Genes
# ----------------- Load Libraries -----------------
library(tidyverse)
library(org.Hs.eg.db)

# ----------------- DEG File Paths -----------------
deg_files <- list(
  "CX_0.1_3" = "data/DEGs/Toptable_CX_0.1_3.csv",
  "CX_0.1_24" = "data/DEGs/Toptable_CX_0.1_24.csv",
  "CX_0.1_48" = "data/DEGs/Toptable_CX_0.1_48.csv",
  "CX_0.5_3" = "data/DEGs/Toptable_CX_0.5_3.csv",
  "CX_0.5_24" = "data/DEGs/Toptable_CX_0.5_24.csv",
  "CX_0.5_48" = "data/DEGs/Toptable_CX_0.5_48.csv",
  "DOX_0.1_3" = "data/DEGs/Toptable_DOX_0.1_3.csv",
  "DOX_0.1_24" = "data/DEGs/Toptable_DOX_0.1_24.csv",
  "DOX_0.1_48" = "data/DEGs/Toptable_DOX_0.1_48.csv",
  "DOX_0.5_3" = "data/DEGs/Toptable_DOX_0.5_3.csv",
  "DOX_0.5_24" = "data/DEGs/Toptable_DOX_0.5_24.csv",
  "DOX_0.5_48" = "data/DEGs/Toptable_DOX_0.5_48.csv"
)

# ----------------- P53 Target Entrez IDs -----------------
entrez_ids <- c(
  1026, 50484, 4193, 9766, 9518, 7832, 1643, 1647, 1263, 57103, 51065, 8795, 51499, 64393, 581, 5228, 5429, 8493, 55959,
  7508, 64782, 282991, 355, 53836, 4814, 10769, 9050, 27244, 9540, 94241, 26154, 57763, 900, 26999, 55332, 26263, 23479,
  23612, 29950, 9618, 10346, 8824, 134147, 55294, 22824, 4254, 6560, 467, 27113, 60492, 8444, 60401, 1969, 220965, 2232,
  3976, 55191, 84284, 93129, 5564, 7803, 83667, 7779, 132671, 7039, 51768, 137695, 93134, 7633, 10973, 340485, 307,
  27350, 23245, 3732, 29965, 1363, 1435, 196513, 8507, 8061, 2517, 51278, 53354, 54858, 23228, 5366, 5912, 6236, 51222,
  26152, 59, 1907, 50650, 91012, 780, 9249, 11072, 144455, 64787, 116151, 27165, 2876, 57822, 55733, 57722, 121457,
  375449, 85377, 4851, 5875, 127544, 29901, 84958, 8797, 8793, 441631, 220001, 54541, 5889, 5054, 25816, 25987, 5111,
  98, 317, 598, 604, 10904, 1294, 80315, 53944, 1606, 2770, 3628, 3675, 3985, 4035, 4163, 84552, 29085, 55367, 5371,
  5791, 54884, 5980, 8794, 1462, 50808, 220, 583, 694, 1056, 9076, 10978, 54677, 1612, 55040, 114907, 2274, 127707,
  4000, 8079, 4646, 4747, 27445, 5143, 80055, 79156, 5360, 5364, 23654, 5565, 5613, 5625, 10076, 56963, 6004, 390,
  255488, 6326, 6330, 23513, 7869, 283130, 204962, 83959, 6548, 6774, 9263, 10228, 22954, 10475, 85363, 494514, 10142,
  79714, 1006, 8446, 9648, 79828, 5507, 55240, 63874, 25841, 9289, 84883, 154810, 51321, 421, 8553, 655, 119032, 84280,
  10950, 824, 839, 57828, 857, 8812, 8837, 94027, 113189, 22837, 132864, 10898, 3300, 81704, 1847, 1849, 1947, 9538,
  24139, 5168, 147965, 115548, 9873, 23768, 2632, 2817, 3280, 3265, 23308, 3490, 51477, 182, 3856, 8844, 144811, 9404,
  4043, 9848, 2872, 23041, 740, 343263, 4638, 26509, 4792, 22861, 57523, 55214, 80025, 164091, 57060, 64065, 51090,
  5453, 8496, 333926, 55671, 5900, 55544, 23179, 8601, 389, 6223, 55800, 6385, 4088, 6643, 122809, 257397, 285343,
  7011, 54790, 374618, 55362, 51754, 7157, 9537, 22906, 7205, 80705, 219699, 55245, 83719, 7748, 25946, 118738
) %>% as.character()

# ----------------- Load and Filter DEGs -----------------
p53_data_list <- map2_dfr(deg_files, names(deg_files), function(file, label) {
  read_csv(file, show_col_types = FALSE) %>%
    mutate(
      Entrez_ID = as.character(Entrez_ID),
      Condition = label,
      Drug = ifelse(str_detect(label, "CX"), "CX.5461", "DOX")
    ) %>%
    filter(Entrez_ID %in% entrez_ids)
})

# ----------------- Complete Combinations -----------------
all_conditions <- names(deg_files)
all_combos <- crossing(
  Entrez_ID = entrez_ids,
  Condition = all_conditions
) %>%
  mutate(
    Drug = ifelse(str_detect(Condition, "CX"), "CX.5461", "DOX")
  )

# ----------------- Merge with DEG Data -----------------
complete_p53 <- all_combos %>%
  left_join(p53_data_list, by = c("Entrez_ID", "Condition", "Drug")) %>%
  mutate(
    logFC = ifelse(is.na(logFC), 0, logFC),
    adj.P.Val = ifelse(is.na(adj.P.Val), 1, adj.P.Val)
  )

# ----------------- Map Gene Symbols -----------------
complete_p53 <- complete_p53 %>%
  mutate(
    Gene = mapIds(org.Hs.eg.db, keys = Entrez_ID,
                  column = "SYMBOL", keytype = "ENTREZID", multiVals = "first")
  )

# ----------------- Order Condition Labels -----------------
complete_p53$Condition <- factor(complete_p53$Condition, levels = c(
  "CX_0.1_3", "CX_0.1_24", "CX_0.1_48",
  "CX_0.5_3", "CX_0.5_24", "CX_0.5_48",
  "DOX_0.1_3", "DOX_0.1_24", "DOX_0.1_48",
  "DOX_0.5_3", "DOX_0.5_24", "DOX_0.5_48"
))

# ----------------- Wilcoxon Tests: CX vs DOX -----------------
condition_pairs <- tibble(
  cx = c("CX_0.1_3", "CX_0.1_24", "CX_0.1_48", "CX_0.5_3", "CX_0.5_24", "CX_0.5_48"),
  dox = c("DOX_0.1_3", "DOX_0.1_24", "DOX_0.1_48", "DOX_0.5_3", "DOX_0.5_24", "DOX_0.5_48")
)

wilcox_results <- map2_dfr(condition_pairs$cx, condition_pairs$dox, function(cx_label, dox_label) {
  cx_vals <- complete_p53 %>% filter(Condition == cx_label) %>% pull(logFC)
  dox_vals <- complete_p53 %>% filter(Condition == dox_label) %>% pull(logFC)

  test <- tryCatch(wilcox.test(cx_vals, dox_vals), error = function(e) NULL)
  pval <- if (!is.null(test)) test$p.value else NA

  tibble(
    Condition = dox_label,
    p_value = signif(pval, 3),
    label = case_when(
      pval < 0.001 ~ "***",
      pval < 0.01  ~ "**",
      pval < 0.05  ~ "*",
      TRUE         ~ ""
    ),
    y_pos = max(c(cx_vals, dox_vals), na.rm = TRUE) + 0.5
  )
})

# ----------------- Final Plot -----------------
ggplot(complete_p53, aes(x = Condition, y = logFC, fill = Drug)) +
  geom_boxplot(outlier.size = 0.6) +
  geom_text(data = wilcox_results,
            aes(x = Condition, y = y_pos, label = label),
            inherit.aes = FALSE,
            size = 4, vjust = 0) +
  scale_fill_manual(values = c("CX.5461" = "blue", "DOX" = "red")) +
  labs(
    title = "LogFC of P53 Target Genes",
    x = "Condition",
    y = "logFC",
    fill = "Drug"
  ) +
  theme_bw(base_size = 14) +
  theme(
    plot.title = element_text(size = rel(1.5), hjust = 0.5),
    axis.title = element_text(size = 14),
    axis.text.x = element_text(angle = 45, hjust = 1, size = 10),
    legend.title = element_text(size = 14),
    legend.text = element_text(size = 12)
  )
📌 LogFC boxplots of TOP2B target Genes
# ----------------- Load Libraries -----------------
library(tidyverse)
library(org.Hs.eg.db)

# ----------------- DEG File Paths -----------------
deg_files <- list(
  "CX_0.1_3" = "data/DEGs/Toptable_CX_0.1_3.csv",
  "CX_0.1_24" = "data/DEGs/Toptable_CX_0.1_24.csv",
  "CX_0.1_48" = "data/DEGs/Toptable_CX_0.1_48.csv",
  "CX_0.5_3" = "data/DEGs/Toptable_CX_0.5_3.csv",
  "CX_0.5_24" = "data/DEGs/Toptable_CX_0.5_24.csv",
  "CX_0.5_48" = "data/DEGs/Toptable_CX_0.5_48.csv",
  "DOX_0.1_3" = "data/DEGs/Toptable_DOX_0.1_3.csv",
  "DOX_0.1_24" = "data/DEGs/Toptable_DOX_0.1_24.csv",
  "DOX_0.1_48" = "data/DEGs/Toptable_DOX_0.1_48.csv",
  "DOX_0.5_3" = "data/DEGs/Toptable_DOX_0.5_3.csv",
  "DOX_0.5_24" = "data/DEGs/Toptable_DOX_0.5_24.csv",
  "DOX_0.5_48" = "data/DEGs/Toptable_DOX_0.5_48.csv"
)

# ----------------- TOP2B Entrez IDs -----------------
top2b_entrez_ids <- read_csv("data/TOP2B_target_mapped.csv", show_col_types = FALSE) %>%
  pull(Entrez_ID) %>%
  unique() %>%
  as.character()

# ----------------- Load & Combine DEG Data -----------------
top2b_data_list <- map2_dfr(deg_files, names(deg_files), function(file, label) {
  read_csv(file, show_col_types = FALSE) %>%
    mutate(Entrez_ID = as.character(Entrez_ID)) %>%  # FIX: Ensure type match
    filter(Entrez_ID %in% top2b_entrez_ids) %>%
    mutate(
      Condition = label,
      Drug = ifelse(str_detect(label, "CX"), "CX.5461", "DOX")
    )
})

# ----------------- Create All Gene × Condition Combos -----------------
all_conditions <- names(deg_files)
all_combos <- crossing(
  Entrez_ID = top2b_entrez_ids,
  Condition = all_conditions
) %>%
  mutate(
    Drug = ifelse(str_detect(Condition, "CX"), "CX.5461", "DOX")
  )

# ----------------- Merge & Impute logFC -----------------
complete_top2b <- all_combos %>%
  left_join(top2b_data_list, by = c("Entrez_ID", "Condition", "Drug")) %>%
  mutate(
    logFC = ifelse(is.na(logFC), 0, logFC),
    adj.P.Val = ifelse(is.na(adj.P.Val), 1, adj.P.Val),
    Gene = mapIds(org.Hs.eg.db, keys = Entrez_ID,
                  column = "SYMBOL", keytype = "ENTREZID", multiVals = "first")
  )

# ----------------- Order X-axis Conditions -----------------
complete_top2b$Condition <- factor(complete_top2b$Condition, levels = c(
  "CX_0.1_3", "CX_0.1_24", "CX_0.1_48",
  "CX_0.5_3", "CX_0.5_24", "CX_0.5_48",
  "DOX_0.1_3", "DOX_0.1_24", "DOX_0.1_48",
  "DOX_0.5_3", "DOX_0.5_24", "DOX_0.5_48"
))

# ----------------- Wilcoxon Test: CX vs DOX per condition -----------------
condition_pairs <- tibble(
  cx = c("CX_0.1_3", "CX_0.1_24", "CX_0.1_48", "CX_0.5_3", "CX_0.5_24", "CX_0.5_48"),
  dox = c("DOX_0.1_3", "DOX_0.1_24", "DOX_0.1_48", "DOX_0.5_3", "DOX_0.5_24", "DOX_0.5_48")
)

wilcox_results <- map2_dfr(condition_pairs$cx, condition_pairs$dox, function(cx_label, dox_label) {
  cx_vals <- complete_top2b %>% filter(Condition == cx_label) %>% pull(logFC)
  dox_vals <- complete_top2b %>% filter(Condition == dox_label) %>% pull(logFC)

  test <- tryCatch(wilcox.test(cx_vals, dox_vals), error = function(e) NULL)
  pval <- if (!is.null(test)) test$p.value else NA

  tibble(
    Condition = dox_label,
    p_value = signif(pval, 3),
    label = case_when(
      pval < 0.001 ~ "***",
      pval < 0.01  ~ "**",
      pval < 0.05  ~ "*",
      TRUE         ~ ""
    ),
    y_pos = max(c(cx_vals, dox_vals), na.rm = TRUE) + 0.5
  )
})

# ----------------- Final Boxplot with Wilcoxon Stars -----------------
ggplot(complete_top2b, aes(x = Condition, y = logFC, fill = Drug)) +
  geom_boxplot(outlier.size = 0.6) +
  geom_text(data = wilcox_results,
            aes(x = Condition, y = y_pos, label = label),
            inherit.aes = FALSE,
            size = 4, vjust = 0) +
  scale_fill_manual(values = c("CX.5461" = "blue", "DOX" = "red")) +
  labs(
    title = "LogFC of TOP2B Target Genes",
    x = "Treatment Condition",
    y = "Log Fold Change",
    fill = "Drug"
  ) +
  theme_bw() +
  theme(
    plot.title = element_text(size = rel(1.5), hjust = 0.5),
    axis.title = element_text(size = 14),
    axis.text.x = element_text(angle = 45, hjust = 1, size = 10),
    legend.title = element_text(size = 14),
    legend.text = element_text(size = 12)
  )
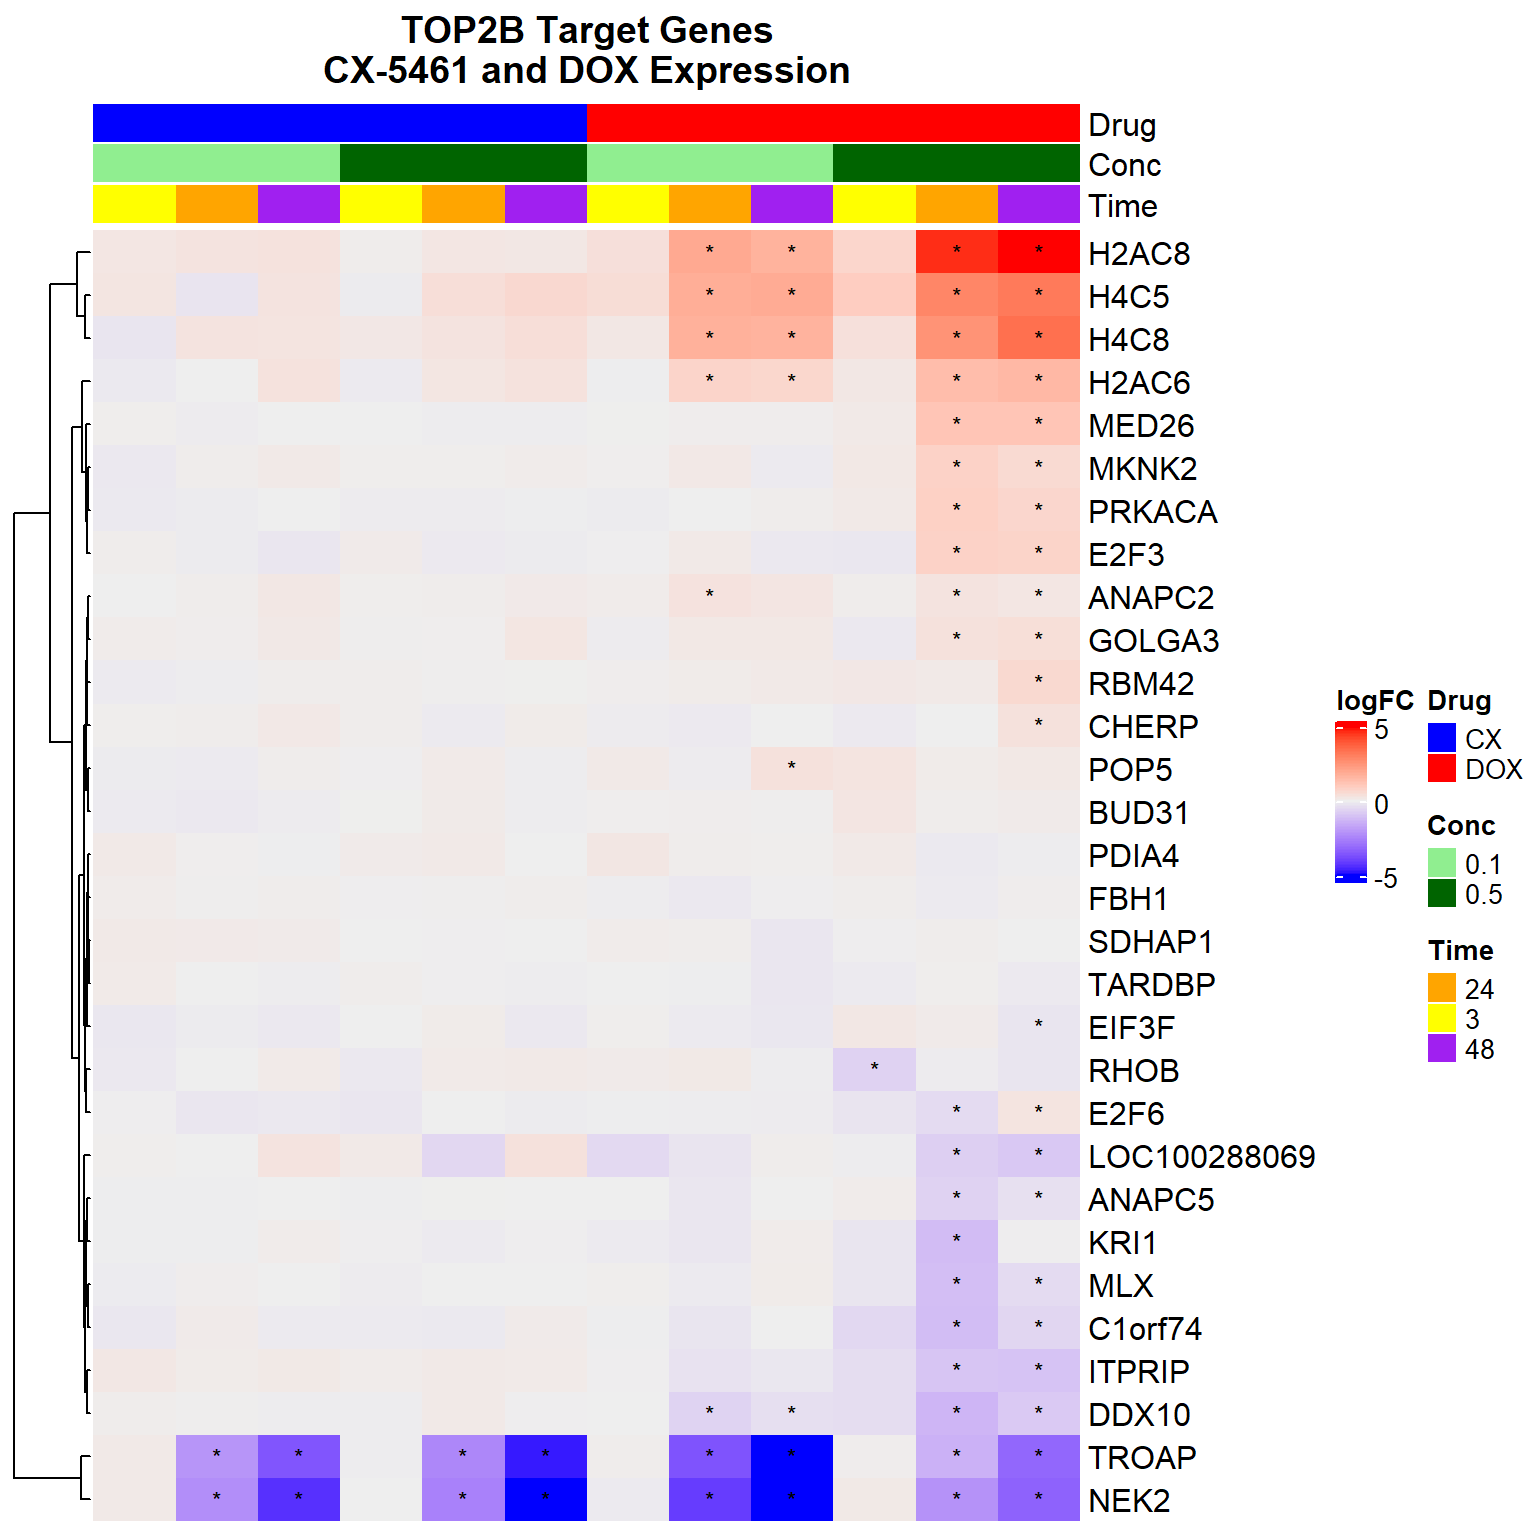
📌 TOP2B target gene expression changes between CX5461 and DOX (ipSC-CM ChIP Seq)
# Load libraries
library(tidyverse)
library(ComplexHeatmap)
library(circlize)
library(grid)
library(org.Hs.eg.db)
library(reshape2)

# Load DEG files
load_deg <- function(path) read.csv(path)

CX_0.1_3 <- load_deg("data/DEGs/Toptable_CX_0.1_3.csv")
CX_0.1_24 <- load_deg("data/DEGs/Toptable_CX_0.1_24.csv")
CX_0.1_48 <- load_deg("data/DEGs/Toptable_CX_0.1_48.csv")
CX_0.5_3 <- load_deg("data/DEGs/Toptable_CX_0.5_3.csv")
CX_0.5_24 <- load_deg("data/DEGs/Toptable_CX_0.5_24.csv")
CX_0.5_48 <- load_deg("data/DEGs/Toptable_CX_0.5_48.csv")
DOX_0.1_3 <- load_deg("data/DEGs/Toptable_DOX_0.1_3.csv")
DOX_0.1_24 <- load_deg("data/DEGs/Toptable_DOX_0.1_24.csv")
DOX_0.1_48 <- load_deg("data/DEGs/Toptable_DOX_0.1_48.csv")
DOX_0.5_3 <- load_deg("data/DEGs/Toptable_DOX_0.5_3.csv")
DOX_0.5_24 <- load_deg("data/DEGs/Toptable_DOX_0.5_24.csv")
DOX_0.5_48 <- load_deg("data/DEGs/Toptable_DOX_0.5_48.csv")

# TOP2B target Entrez IDs
entrez_ids <- c(
  8365, 8367, 8334, 79171, 1876, 2802, 3012, 10024, 85450, 6945,
  100288069, 51367, 8665, 9441, 148304, 51433, 29882, 84893, 4751, 1662,
  9601, 2872, 255812, 1871, 10523, 23435, 8896, 5566, 65095, 388
)

# Function to extract relevant data
extract_data <- function(df, name) {
  df %>%
    filter(Entrez_ID %in% entrez_ids) %>%
    mutate(
      Gene = mapIds(org.Hs.eg.db, as.character(Entrez_ID),
                    column = "SYMBOL", keytype = "ENTREZID", multiVals = "first"),
      Condition = name,
      Signif = ifelse(adj.P.Val < 0.05, "*", "")
    )
}

# Combine DEG data
deg_list <- list(
  "CX_0.1_3" = CX_0.1_3, "CX_0.1_24" = CX_0.1_24, "CX_0.1_48" = CX_0.1_48,
  "CX_0.5_3" = CX_0.5_3, "CX_0.5_24" = CX_0.5_24, "CX_0.5_48" = CX_0.5_48,
  "DOX_0.1_3" = DOX_0.1_3, "DOX_0.1_24" = DOX_0.1_24, "DOX_0.1_48" = DOX_0.1_48,
  "DOX_0.5_3" = DOX_0.5_3, "DOX_0.5_24" = DOX_0.5_24, "DOX_0.5_48" = DOX_0.5_48
)

all_data <- bind_rows(mapply(extract_data, deg_list, names(deg_list), SIMPLIFY = FALSE))

# Create logFC and significance matrices
logFC_mat <- acast(all_data, Gene ~ Condition, value.var = "logFC")
signif_mat <- acast(all_data, Gene ~ Condition, value.var = "Signif")

# Desired condition order
desired_order <- c("CX_0.1_3", "CX_0.1_24", "CX_0.1_48",
                   "CX_0.5_3", "CX_0.5_24", "CX_0.5_48",
                   "DOX_0.1_3", "DOX_0.1_24", "DOX_0.1_48",
                   "DOX_0.5_3", "DOX_0.5_24", "DOX_0.5_48")

logFC_mat <- logFC_mat[, desired_order, drop = FALSE]
signif_mat <- signif_mat[, desired_order, drop = FALSE]

# Top annotation
meta <- str_split_fixed(colnames(logFC_mat), "_", 3)
col_annot <- HeatmapAnnotation(
  Drug = meta[, 1],
  Conc = meta[, 2],
  Time = meta[, 3],
  col = list(
    Drug = c("CX" = "blue", "DOX" = "red"),
    Conc = c("0.1" = "lightgreen", "0.5" = "darkgreen"),
    Time = c("3" = "yellow", "24" = "orange", "48" = "purple")
  ),
  annotation_height = unit(c(2, 2, 2), "cm")
)

# Plot heatmap
Heatmap(logFC_mat,
        name = "logFC",
        top_annotation = col_annot,
        cluster_columns = FALSE,
        cluster_rows = TRUE,
        show_row_names = TRUE,
        show_column_names = FALSE,
        cell_fun = function(j, i, x, y, width, height, fill) {
          grid.text(signif_mat[i, j], x, y, gp = gpar(fontsize = 9))
        },
        column_title = "TOP2B Target Genes\nCX-5461 and DOX Expression",
        column_title_gp = gpar(fontsize = 14, fontface = "bold")
)
| Version | Author | Date |
|---|---|---|
| 328c60f | sayanpaul01 | 2025-05-08 |
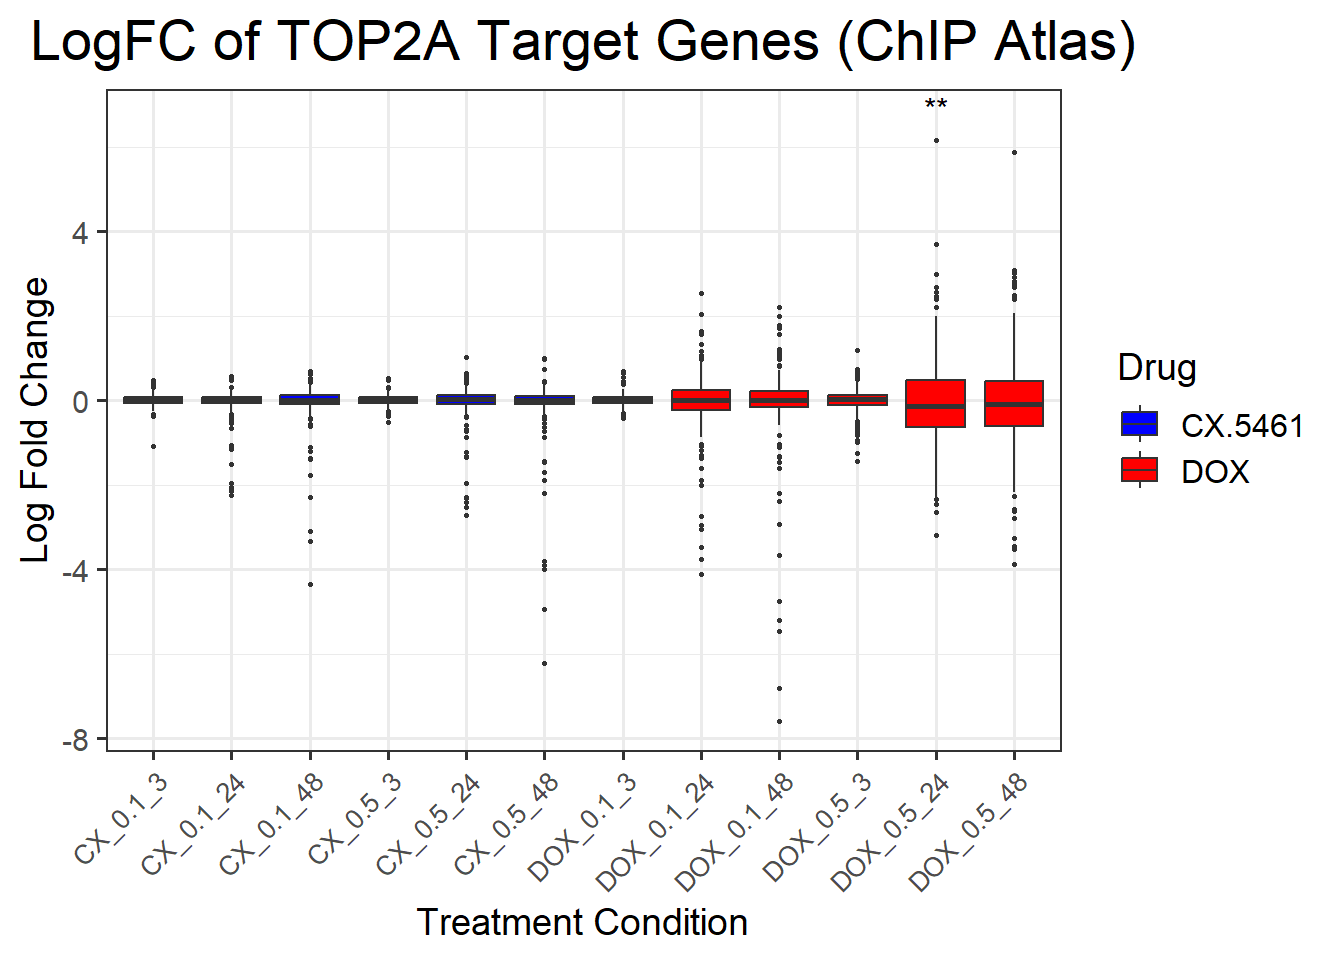
📌 LogFC boxplots of TOP2A target Genes (ChIP Atlas)
# ----------------- Load Libraries -----------------
library(tidyverse)
library(org.Hs.eg.db)

# ----------------- DEG File Paths -----------------
deg_files <- list(
  "CX_0.1_3" = "data/DEGs/Toptable_CX_0.1_3.csv",
  "CX_0.1_24" = "data/DEGs/Toptable_CX_0.1_24.csv",
  "CX_0.1_48" = "data/DEGs/Toptable_CX_0.1_48.csv",
  "CX_0.5_3" = "data/DEGs/Toptable_CX_0.5_3.csv",
  "CX_0.5_24" = "data/DEGs/Toptable_CX_0.5_24.csv",
  "CX_0.5_48" = "data/DEGs/Toptable_CX_0.5_48.csv",
  "DOX_0.1_3" = "data/DEGs/Toptable_DOX_0.1_3.csv",
  "DOX_0.1_24" = "data/DEGs/Toptable_DOX_0.1_24.csv",
  "DOX_0.1_48" = "data/DEGs/Toptable_DOX_0.1_48.csv",
  "DOX_0.5_3" = "data/DEGs/Toptable_DOX_0.5_3.csv",
  "DOX_0.5_24" = "data/DEGs/Toptable_DOX_0.5_24.csv",
  "DOX_0.5_48" = "data/DEGs/Toptable_DOX_0.5_48.csv"
)

# ----------------- Load TOP2A Entrez IDs -----------------
top2a_entrez_ids <- read_csv("data/TOP2A_target_mapped.csv", show_col_types = FALSE) %>%
  pull(Entrez_ID) %>%
  unique() %>%
  as.character()

# ----------------- Load & Filter DEGs -----------------
top2a_data_list <- map2_dfr(deg_files, names(deg_files), function(file, label) {
  read_csv(file, show_col_types = FALSE) %>%
    mutate(Entrez_ID = as.character(Entrez_ID)) %>%
    filter(Entrez_ID %in% top2a_entrez_ids) %>%
    mutate(
      Condition = label,
      Drug = ifelse(str_detect(label, "CX"), "CX.5461", "DOX")
    )
})

# ----------------- Create All Gene × Condition Combos -----------------
all_conditions <- names(deg_files)
all_combos <- crossing(
  Entrez_ID = top2a_entrez_ids,
  Condition = all_conditions
) %>%
  mutate(
    Drug = ifelse(str_detect(Condition, "CX"), "CX.5461", "DOX")
  )

# ----------------- Merge & Impute logFC -----------------
complete_top2a <- all_combos %>%
  left_join(top2a_data_list, by = c("Entrez_ID", "Condition", "Drug")) %>%
  mutate(
    logFC = ifelse(is.na(logFC), 0, logFC),
    adj.P.Val = ifelse(is.na(adj.P.Val), 1, adj.P.Val),
    Gene = mapIds(org.Hs.eg.db, keys = as.character(Entrez_ID),
                  column = "SYMBOL", keytype = "ENTREZID", multiVals = "first")
  )

# ----------------- Order X-axis Conditions -----------------
complete_top2a$Condition <- factor(complete_top2a$Condition, levels = c(
  "CX_0.1_3", "CX_0.1_24", "CX_0.1_48",
  "CX_0.5_3", "CX_0.5_24", "CX_0.5_48",
  "DOX_0.1_3", "DOX_0.1_24", "DOX_0.1_48",
  "DOX_0.5_3", "DOX_0.5_24", "DOX_0.5_48"
))

# ----------------- Wilcoxon Test: CX vs DOX per condition -----------------
condition_pairs <- tibble(
  cx = c("CX_0.1_3", "CX_0.1_24", "CX_0.1_48", "CX_0.5_3", "CX_0.5_24", "CX_0.5_48"),
  dox = c("DOX_0.1_3", "DOX_0.1_24", "DOX_0.1_48", "DOX_0.5_3", "DOX_0.5_24", "DOX_0.5_48")
)

wilcox_results <- map2_dfr(condition_pairs$cx, condition_pairs$dox, function(cx_label, dox_label) {
  cx_vals <- complete_top2a %>% filter(Condition == cx_label) %>% pull(logFC)
  dox_vals <- complete_top2a %>% filter(Condition == dox_label) %>% pull(logFC)

  test <- tryCatch(wilcox.test(cx_vals, dox_vals), error = function(e) NULL)
  pval <- if (!is.null(test)) test$p.value else NA

  tibble(
    Condition = dox_label,
    p_value = signif(pval, 3),
    label = case_when(
      pval < 0.001 ~ "***",
      pval < 0.01 ~ "**",
      pval < 0.05 ~ "*",
      TRUE ~ ""
    ),
    y_pos = max(c(cx_vals, dox_vals), na.rm = TRUE) + 0.5
  )
})

# ----------------- Final Boxplot -----------------
ggplot(complete_top2a, aes(x = Condition, y = logFC, fill = Drug)) +
  geom_boxplot(outlier.size = 0.6) +
  geom_text(data = wilcox_results,
            aes(x = Condition, y = y_pos, label = label),
            inherit.aes = FALSE,
            size = 4, vjust = 0) +
  scale_fill_manual(values = c("CX.5461" = "blue", "DOX" = "red")) +
  labs(
    title = "LogFC of TOP2A Target Genes (ChIP Atlas)",
    x = "Treatment Condition",
    y = "Log Fold Change",
    fill = "Drug"
  ) +
  theme_bw(base_size = 14) +
  theme(
    plot.title = element_text(size = rel(1.5), hjust = 0.5),
    axis.title = element_text(size = 14),
    axis.text.x = element_text(angle = 45, hjust = 1, size = 10),
    legend.title = element_text(size = 14),
    legend.text = element_text(size = 12)
  )
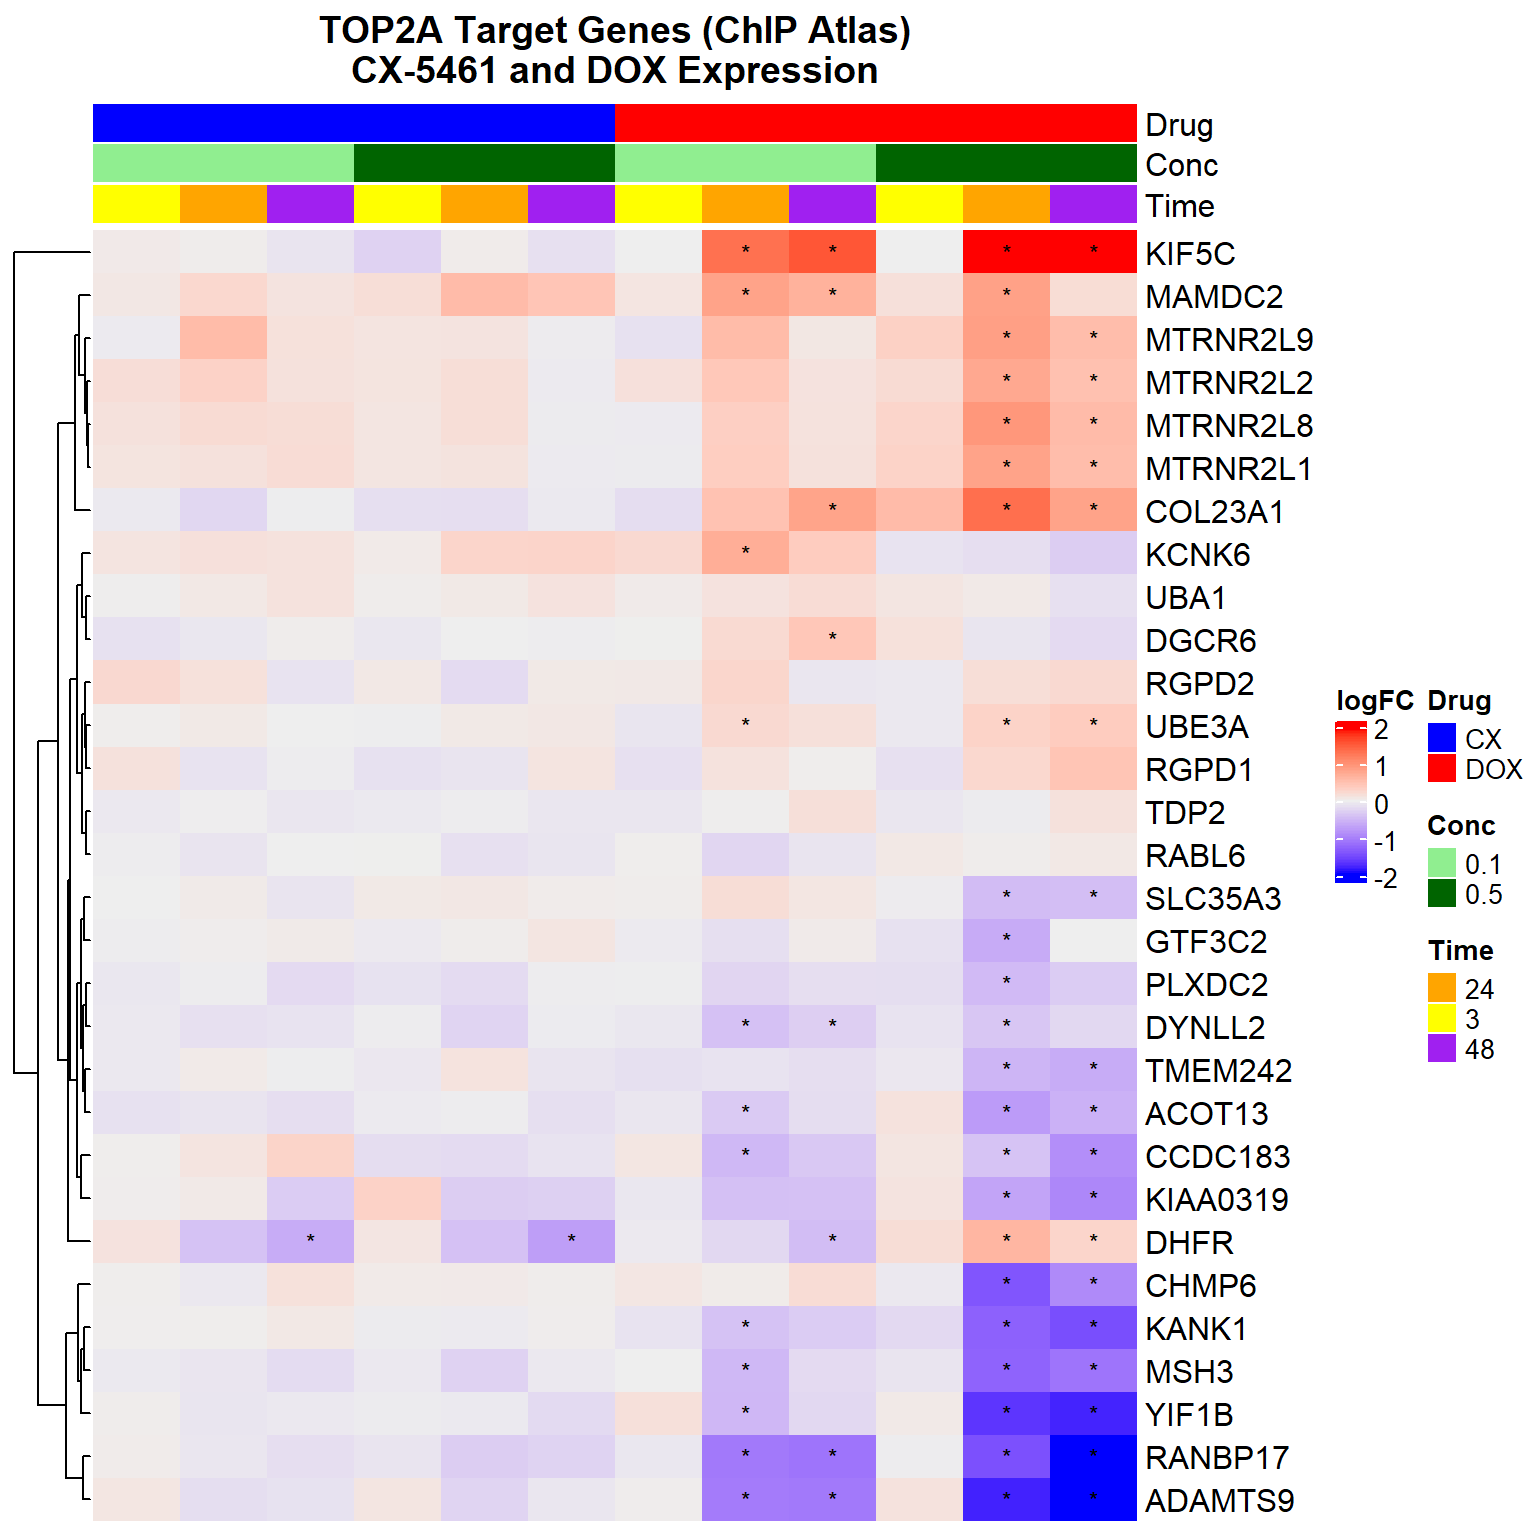
📌 TOP2A target gene expression changes between CX5461 and DOX (ChIP_Atlas)
# Load libraries
library(tidyverse)
library(ComplexHeatmap)
library(circlize)
library(grid)
library(org.Hs.eg.db)
library(reshape2)

# Load DEG files
load_deg <- function(path) read.csv(path)

CX_0.1_3 <- load_deg("data/DEGs/Toptable_CX_0.1_3.csv")
CX_0.1_24 <- load_deg("data/DEGs/Toptable_CX_0.1_24.csv")
CX_0.1_48 <- load_deg("data/DEGs/Toptable_CX_0.1_48.csv")
CX_0.5_3 <- load_deg("data/DEGs/Toptable_CX_0.5_3.csv")
CX_0.5_24 <- load_deg("data/DEGs/Toptable_CX_0.5_24.csv")
CX_0.5_48 <- load_deg("data/DEGs/Toptable_CX_0.5_48.csv")
DOX_0.1_3 <- load_deg("data/DEGs/Toptable_DOX_0.1_3.csv")
DOX_0.1_24 <- load_deg("data/DEGs/Toptable_DOX_0.1_24.csv")
DOX_0.1_48 <- load_deg("data/DEGs/Toptable_DOX_0.1_48.csv")
DOX_0.5_3 <- load_deg("data/DEGs/Toptable_DOX_0.5_3.csv")
DOX_0.5_24 <- load_deg("data/DEGs/Toptable_DOX_0.5_24.csv")
DOX_0.5_48 <- load_deg("data/DEGs/Toptable_DOX_0.5_48.csv")

# TOP2A ChIP Atlas Entrez IDs
entrez_ids <- c(
  9856, 100462981, 4437, 1719, 256691, 100462977, 100463486, 91522, 8214, 51567,
  55856, 3800, 84898, 729857, 400966, 56999, 7317, 729515, 55684, 84960, 7337,
  64901, 140735, 23443, 100463487, 79643, 2976, 90522, 9424, 23189
)

# Extract relevant data
extract_data <- function(df, name) {
  df %>%
    filter(Entrez_ID %in% entrez_ids) %>%
    mutate(
      Gene = mapIds(org.Hs.eg.db, as.character(Entrez_ID),
                    column = "SYMBOL", keytype = "ENTREZID", multiVals = "first"),
      Condition = name,
      Signif = ifelse(adj.P.Val < 0.05, "*", "")
    )
}

# Combine DEG data
deg_list <- list(
  "CX_0.1_3" = CX_0.1_3, "CX_0.1_24" = CX_0.1_24, "CX_0.1_48" = CX_0.1_48,
  "CX_0.5_3" = CX_0.5_3, "CX_0.5_24" = CX_0.5_24, "CX_0.5_48" = CX_0.5_48,
  "DOX_0.1_3" = DOX_0.1_3, "DOX_0.1_24" = DOX_0.1_24, "DOX_0.1_48" = DOX_0.1_48,
  "DOX_0.5_3" = DOX_0.5_3, "DOX_0.5_24" = DOX_0.5_24, "DOX_0.5_48" = DOX_0.5_48
)

all_data <- bind_rows(mapply(extract_data, deg_list, names(deg_list), SIMPLIFY = FALSE))

# Create logFC and significance matrices
logFC_mat <- acast(all_data, Gene ~ Condition, value.var = "logFC")
signif_mat <- acast(all_data, Gene ~ Condition, value.var = "Signif")

# Desired condition order
desired_order <- c("CX_0.1_3", "CX_0.1_24", "CX_0.1_48",
                   "CX_0.5_3", "CX_0.5_24", "CX_0.5_48",
                   "DOX_0.1_3", "DOX_0.1_24", "DOX_0.1_48",
                   "DOX_0.5_3", "DOX_0.5_24", "DOX_0.5_48")

logFC_mat <- logFC_mat[, desired_order, drop = FALSE]
signif_mat <- signif_mat[, desired_order, drop = FALSE]

# Column annotation
meta <- str_split_fixed(colnames(logFC_mat), "_", 3)
col_annot <- HeatmapAnnotation(
  Drug = meta[, 1],
  Conc = meta[, 2],
  Time = meta[, 3],
  col = list(
    Drug = c("CX" = "blue", "DOX" = "red"),
    Conc = c("0.1" = "lightgreen", "0.5" = "darkgreen"),
    Time = c("3" = "yellow", "24" = "orange", "48" = "purple")
  ),
  annotation_height = unit(c(2, 2, 2), "cm")
)

# Draw heatmap
Heatmap(logFC_mat,
        name = "logFC",
        top_annotation = col_annot,
        cluster_columns = FALSE,
        cluster_rows = TRUE,
        show_row_names = TRUE,
        show_column_names = FALSE,
        cell_fun = function(j, i, x, y, width, height, fill) {
          grid.text(signif_mat[i, j], x, y, gp = gpar(fontsize = 9))
        },
        column_title = "TOP2A Target Genes (ChIP Atlas)\nCX-5461 and DOX Expression",
        column_title_gp = gpar(fontsize = 14, fontface = "bold")
)
| Version | Author | Date |
|---|---|---|
| 328c60f | sayanpaul01 | 2025-05-08 |
📌 LogFC boxplots of TOP2A target Genes (RPE-1 cell line)
# ----------------- Load Libraries -----------------
library(tidyverse)
library(org.Hs.eg.db)

# ----------------- DEG File Paths -----------------
deg_files <- list(
  "CX_0.1_3" = "data/DEGs/Toptable_CX_0.1_3.csv",
  "CX_0.1_24" = "data/DEGs/Toptable_CX_0.1_24.csv",
  "CX_0.1_48" = "data/DEGs/Toptable_CX_0.1_48.csv",
  "CX_0.5_3" = "data/DEGs/Toptable_CX_0.5_3.csv",
  "CX_0.5_24" = "data/DEGs/Toptable_CX_0.5_24.csv",
  "CX_0.5_48" = "data/DEGs/Toptable_CX_0.5_48.csv",
  "DOX_0.1_3" = "data/DEGs/Toptable_DOX_0.1_3.csv",
  "DOX_0.1_24" = "data/DEGs/Toptable_DOX_0.1_24.csv",
  "DOX_0.1_48" = "data/DEGs/Toptable_DOX_0.1_48.csv",
  "DOX_0.5_3" = "data/DEGs/Toptable_DOX_0.5_3.csv",
  "DOX_0.5_24" = "data/DEGs/Toptable_DOX_0.5_24.csv",
  "DOX_0.5_48" = "data/DEGs/Toptable_DOX_0.5_48.csv"
)

# ----------------- Load TOP2A (RPE-1) Entrez IDs -----------------
top2a_lit_ids <- read_csv("data/TOP2A_target_lit_mapped.csv", show_col_types = FALSE) %>%
  pull(Entrez_ID) %>%
  unique() %>%
  as.character()

# ----------------- Load & Filter DEGs -----------------
top2a_lit_data <- map2_dfr(deg_files, names(deg_files), function(file, label) {
  read_csv(file, show_col_types = FALSE) %>%
    mutate(Entrez_ID = as.character(Entrez_ID)) %>%
    filter(Entrez_ID %in% top2a_lit_ids) %>%
    mutate(
      Condition = label,
      Drug = ifelse(str_detect(label, "CX"), "CX.5461", "DOX")
    )
})

# ----------------- Create All Gene × Condition Combos -----------------
all_conditions <- names(deg_files)
all_combos <- crossing(
  Entrez_ID = top2a_lit_ids,
  Condition = all_conditions
) %>%
  mutate(
    Drug = ifelse(str_detect(Condition, "CX"), "CX.5461", "DOX")
  )

# ----------------- Merge & Impute logFC -----------------
complete_top2a_lit <- all_combos %>%
  left_join(top2a_lit_data, by = c("Entrez_ID", "Condition", "Drug")) %>%
  mutate(
    logFC = ifelse(is.na(logFC), 0, logFC),
    adj.P.Val = ifelse(is.na(adj.P.Val), 1, adj.P.Val),
    Gene = mapIds(org.Hs.eg.db, keys = as.character(Entrez_ID),
                  column = "SYMBOL", keytype = "ENTREZID", multiVals = "first")
  )

# ----------------- Order Conditions -----------------
complete_top2a_lit$Condition <- factor(complete_top2a_lit$Condition, levels = c(
  "CX_0.1_3", "CX_0.1_24", "CX_0.1_48",
  "CX_0.5_3", "CX_0.5_24", "CX_0.5_48",
  "DOX_0.1_3", "DOX_0.1_24", "DOX_0.1_48",
  "DOX_0.5_3", "DOX_0.5_24", "DOX_0.5_48"
))

# ----------------- Wilcoxon Test: CX vs DOX -----------------
condition_pairs <- tibble(
  cx = c("CX_0.1_3", "CX_0.1_24", "CX_0.1_48", "CX_0.5_3", "CX_0.5_24", "CX_0.5_48"),
  dox = c("DOX_0.1_3", "DOX_0.1_24", "DOX_0.1_48", "DOX_0.5_3", "DOX_0.5_24", "DOX_0.5_48")
)

wilcox_results <- map2_dfr(condition_pairs$cx, condition_pairs$dox, function(cx_label, dox_label) {
  cx_vals <- complete_top2a_lit %>% filter(Condition == cx_label) %>% pull(logFC)
  dox_vals <- complete_top2a_lit %>% filter(Condition == dox_label) %>% pull(logFC)

  test <- tryCatch(wilcox.test(cx_vals, dox_vals), error = function(e) NULL)
  pval <- if (!is.null(test)) test$p.value else NA

  tibble(
    Condition = dox_label,
    p_value = signif(pval, 3),
    label = case_when(
      pval < 0.001 ~ "***",
      pval < 0.01 ~ "**",
      pval < 0.05 ~ "*",
      TRUE ~ ""
    ),
    y_pos = max(c(cx_vals, dox_vals), na.rm = TRUE) + 0.5
  )
})

# ----------------- Final Boxplot -----------------
ggplot(complete_top2a_lit, aes(x = Condition, y = logFC, fill = Drug)) +
  geom_boxplot(outlier.size = 0.6) +
  geom_text(data = wilcox_results,
            aes(x = Condition, y = y_pos, label = label),
            inherit.aes = FALSE,
            size = 4, vjust = 0) +
  scale_fill_manual(values = c("CX.5461" = "blue", "DOX" = "red")) +
  labs(
    title = "LogFC of TOP2A Target Genes\n(RPE-1, Literature)",
    x = "Treatment Condition",
    y = "Log Fold Change",
    fill = "Drug"
  ) +
  theme_bw(base_size = 14) +
  theme(
    plot.title = element_text(size = rel(1.5), hjust = 0.5),
    axis.title = element_text(size = 14),
    axis.text.x = element_text(angle = 45, hjust = 1, size = 10),
    legend.title = element_text(size = 14),
    legend.text = element_text(size = 12)
  )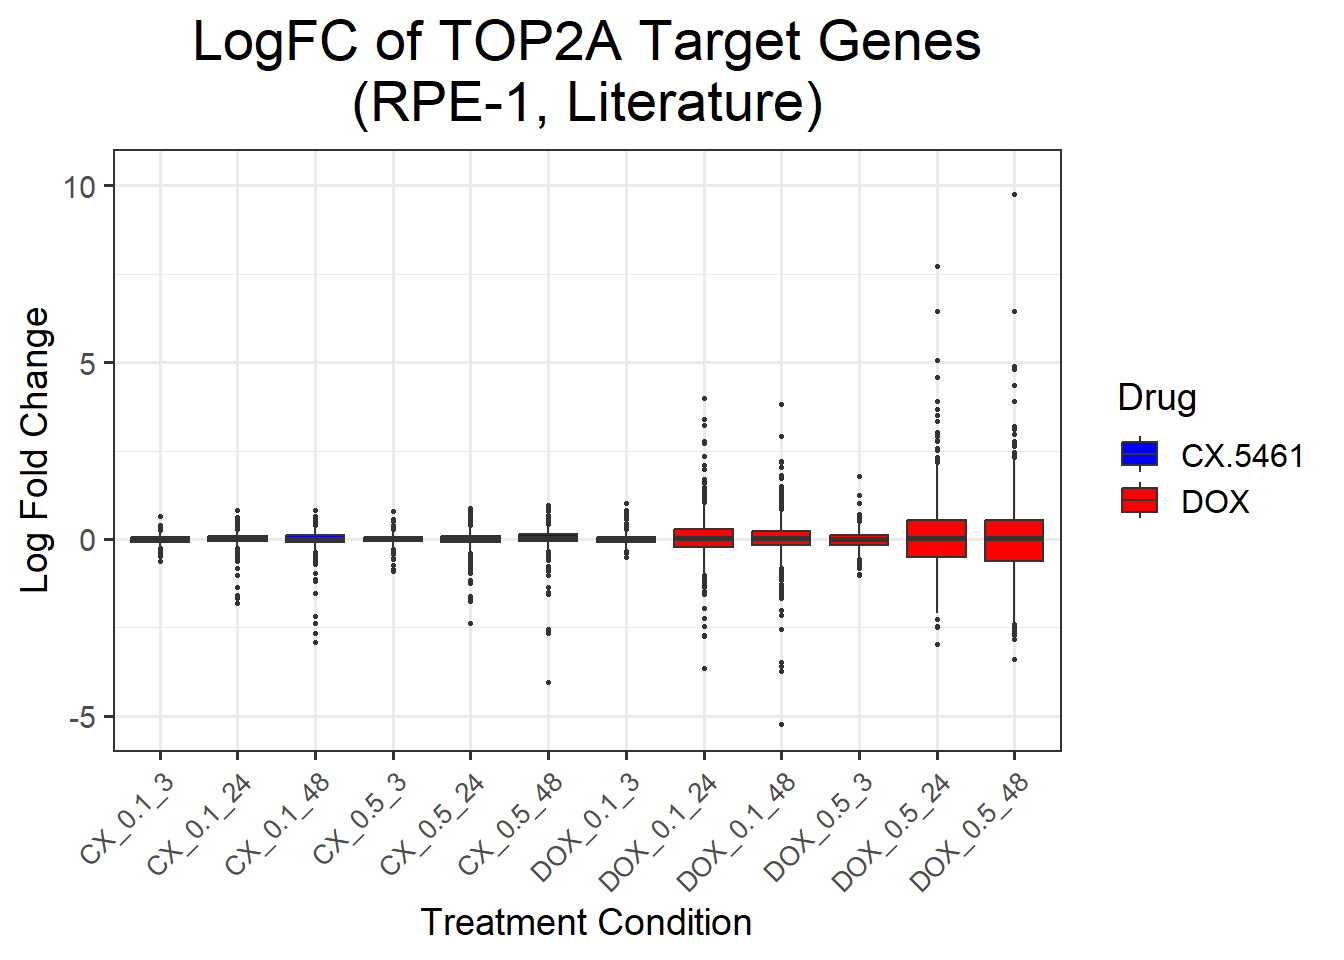
📌 LogFC boxplots of Anthracycline cardiotoxicity genes
# ----------------- Load Libraries -----------------
library(tidyverse)
library(org.Hs.eg.db)

# ----------------- DEG File Paths -----------------
deg_files <- list(
  "CX_0.1_3" = "data/DEGs/Toptable_CX_0.1_3.csv",
  "CX_0.1_24" = "data/DEGs/Toptable_CX_0.1_24.csv",
  "CX_0.1_48" = "data/DEGs/Toptable_CX_0.1_48.csv",
  "CX_0.5_3" = "data/DEGs/Toptable_CX_0.5_3.csv",
  "CX_0.5_24" = "data/DEGs/Toptable_CX_0.5_24.csv",
  "CX_0.5_48" = "data/DEGs/Toptable_CX_0.5_48.csv",
  "DOX_0.1_3" = "data/DEGs/Toptable_DOX_0.1_3.csv",
  "DOX_0.1_24" = "data/DEGs/Toptable_DOX_0.1_24.csv",
  "DOX_0.1_48" = "data/DEGs/Toptable_DOX_0.1_48.csv",
  "DOX_0.5_3" = "data/DEGs/Toptable_DOX_0.5_3.csv",
  "DOX_0.5_24" = "data/DEGs/Toptable_DOX_0.5_24.csv",
  "DOX_0.5_48" = "data/DEGs/Toptable_DOX_0.5_48.csv"
)

# ----------------- AC Cardiotoxicity Entrez IDs -----------------
entrez_ids <- c(
  6272, 8029, 11128, 79899, 54477, 121665, 5095, 22863, 57161, 4692,
  8214, 23151, 56606, 108, 22999, 56895, 9603, 3181, 4023, 10499,
  92949, 4363, 10057, 5243, 5244, 5880, 1535, 2950, 847, 5447,
  3038, 3077, 4846, 3958, 23327, 29899, 23155, 80856, 55020, 78996,
  23262, 150383, 9620, 79730, 344595, 5066, 6251, 3482, 9588, 339416,
  7292, 55157, 87769, 23409, 720, 3107, 54535, 1590, 80059, 7991,
  57110, 8803, 323, 54826, 5916, 23371, 283337, 64078, 80010, 1933,
  10818, 51020
) %>% as.character()

# ----------------- Load and Filter DEGs -----------------
ac_data_list <- map2_dfr(deg_files, names(deg_files), function(file, label) {
  read_csv(file, show_col_types = FALSE) %>%
    mutate(
      Entrez_ID = as.character(Entrez_ID),
      Condition = label,
      Drug = ifelse(str_detect(label, "CX"), "CX.5461", "DOX")
    ) %>%
    filter(Entrez_ID %in% entrez_ids)
})

# ----------------- Create Full Gene × Condition Table -----------------
all_conditions <- names(deg_files)
all_combos <- crossing(
  Entrez_ID = entrez_ids %>% as.character(),
  Condition = all_conditions
) %>%
  mutate(
    Drug = ifelse(str_detect(Condition, "CX"), "CX.5461", "DOX")
  )

# ----------------- Merge and Fill Missing Values -----------------
complete_ac <- all_combos %>%
  left_join(ac_data_list, by = c("Entrez_ID", "Condition", "Drug")) %>%
  mutate(
    logFC = ifelse(is.na(logFC), 0, logFC),
    adj.P.Val = ifelse(is.na(adj.P.Val), 1, adj.P.Val)
  )

# ----------------- Annotate Gene Symbols -----------------
complete_ac <- complete_ac %>%
  mutate(
    Gene = mapIds(org.Hs.eg.db, keys = Entrez_ID,
                  column = "SYMBOL", keytype = "ENTREZID", multiVals = "first")
  )

# ----------------- Order Conditions -----------------
complete_ac$Condition <- factor(complete_ac$Condition, levels = c(
  "CX_0.1_3", "CX_0.1_24", "CX_0.1_48",
  "CX_0.5_3", "CX_0.5_24", "CX_0.5_48",
  "DOX_0.1_3", "DOX_0.1_24", "DOX_0.1_48",
  "DOX_0.5_3", "DOX_0.5_24", "DOX_0.5_48"
))

# ----------------- Wilcoxon Test: CX vs DOX (paired by condition) -----------------
condition_pairs <- tibble(
  cx = c("CX_0.1_3", "CX_0.1_24", "CX_0.1_48", "CX_0.5_3", "CX_0.5_24", "CX_0.5_48"),
  dox = c("DOX_0.1_3", "DOX_0.1_24", "DOX_0.1_48", "DOX_0.5_3", "DOX_0.5_24", "DOX_0.5_48")
)

wilcox_results <- map2_dfr(condition_pairs$cx, condition_pairs$dox, function(cx_label, dox_label) {
  cx_vals <- complete_ac %>% filter(Condition == cx_label) %>% pull(logFC)
  dox_vals <- complete_ac %>% filter(Condition == dox_label) %>% pull(logFC)

  test <- tryCatch(wilcox.test(cx_vals, dox_vals), error = function(e) NULL)
  pval <- if (!is.null(test)) test$p.value else NA

  tibble(
    Condition = dox_label,
    p_value = signif(pval, 3),
    label = case_when(
      pval < 0.001 ~ "***",
      pval < 0.01  ~ "**",
      pval < 0.05  ~ "*",
      TRUE         ~ ""
    ),
    y_pos = max(c(cx_vals, dox_vals), na.rm = TRUE) + 0.5
  )
})

# ----------------- Plot Boxplot with Wilcoxon Stars -----------------
ggplot(complete_ac, aes(x = Condition, y = logFC, fill = Drug)) +
  geom_boxplot(outlier.size = 0.6) +
  geom_text(data = wilcox_results,
            aes(x = Condition, y = y_pos, label = label),
            inherit.aes = FALSE,
            size = 4, vjust = 0) +
  scale_fill_manual(values = c("CX.5461" = "blue", "DOX" = "red")) +
  labs(
    title = "LogFC of AC Cardiotoxicity Genes",
    x = "Condition",
    y = "logFC",
    fill = "Drug"
  ) +
  theme_bw(base_size = 14) +
  theme(
    plot.title = element_text(size = rel(1.5), hjust = 0.5),
    axis.title = element_text(size = 14),
    axis.text.x = element_text(angle = 45, hjust = 1, size = 10),
    legend.title = element_text(size = 14),
    legend.text = element_text(size = 12)
  )
| Version | Author | Date |
|---|---|---|
| 48c7dd9 | sayanpaul01 | 2025-05-13 |
📌 LogFC boxplots of DOX cardiotoxicity genes
# ----------------- Load Libraries -----------------
library(tidyverse)
library(org.Hs.eg.db)

# ----------------- DEG File Paths -----------------
deg_files <- list(
  "CX_0.1_3" = "data/DEGs/Toptable_CX_0.1_3.csv",
  "CX_0.1_24" = "data/DEGs/Toptable_CX_0.1_24.csv",
  "CX_0.1_48" = "data/DEGs/Toptable_CX_0.1_48.csv",
  "CX_0.5_3" = "data/DEGs/Toptable_CX_0.5_3.csv",
  "CX_0.5_24" = "data/DEGs/Toptable_CX_0.5_24.csv",
  "CX_0.5_48" = "data/DEGs/Toptable_CX_0.5_48.csv",
  "DOX_0.1_3" = "data/DEGs/Toptable_DOX_0.1_3.csv",
  "DOX_0.1_24" = "data/DEGs/Toptable_DOX_0.1_24.csv",
  "DOX_0.1_48" = "data/DEGs/Toptable_DOX_0.1_48.csv",
  "DOX_0.5_3" = "data/DEGs/Toptable_DOX_0.5_3.csv",
  "DOX_0.5_24" = "data/DEGs/Toptable_DOX_0.5_24.csv",
  "DOX_0.5_48" = "data/DEGs/Toptable_DOX_0.5_48.csv"
)

# ----------------- DOX Cardiotoxicity Entrez IDs -----------------
entrez_ids <- c(
  847, 873, 2064, 2878, 2944, 3038, 4846, 51196, 5880, 6687,
  7799, 4292, 5916, 3077, 51310, 9154, 64078, 5244, 10057, 10060,
  89845, 56853, 4625, 1573, 79890
) %>% as.character()

# ----------------- Load and Filter DEGs -----------------
tox_data_list <- map2_dfr(deg_files, names(deg_files), function(file, label) {
  read_csv(file, show_col_types = FALSE) %>%
    mutate(
      Entrez_ID = as.character(Entrez_ID),
      Condition = label,
      Drug = ifelse(str_detect(label, "CX"), "CX.5461", "DOX")
    ) %>%
    filter(Entrez_ID %in% entrez_ids)
})

# ----------------- Create Full Gene × Condition Table -----------------
all_conditions <- names(deg_files)
all_combos <- crossing(
  Entrez_ID = entrez_ids,
  Condition = all_conditions
) %>%
  mutate(
    Drug = ifelse(str_detect(Condition, "CX"), "CX.5461", "DOX")
  )

# ----------------- Merge and Fill Missing Values -----------------
complete_doxcardio <- all_combos %>%
  left_join(tox_data_list, by = c("Entrez_ID", "Condition", "Drug")) %>%
  mutate(
    logFC = ifelse(is.na(logFC), 0, logFC),
    adj.P.Val = ifelse(is.na(adj.P.Val), 1, adj.P.Val)
  )

# ----------------- Annotate Gene Symbols -----------------
complete_doxcardio <- complete_doxcardio %>%
  mutate(
    Gene = mapIds(org.Hs.eg.db, keys = Entrez_ID,
                  column = "SYMBOL", keytype = "ENTREZID", multiVals = "first")
  )

# ----------------- Order Conditions -----------------
complete_doxcardio$Condition <- factor(complete_doxcardio$Condition, levels = c(
  "CX_0.1_3", "CX_0.1_24", "CX_0.1_48",
  "CX_0.5_3", "CX_0.5_24", "CX_0.5_48",
  "DOX_0.1_3", "DOX_0.1_24", "DOX_0.1_48",
  "DOX_0.5_3", "DOX_0.5_24", "DOX_0.5_48"
))

# ----------------- Wilcoxon Test: CX vs DOX (paired by condition) -----------------
condition_pairs <- tibble(
  cx = c("CX_0.1_3", "CX_0.1_24", "CX_0.1_48", "CX_0.5_3", "CX_0.5_24", "CX_0.5_48"),
  dox = c("DOX_0.1_3", "DOX_0.1_24", "DOX_0.1_48", "DOX_0.5_3", "DOX_0.5_24", "DOX_0.5_48")
)

wilcox_results <- map2_dfr(condition_pairs$cx, condition_pairs$dox, function(cx_label, dox_label) {
  cx_vals <- complete_doxcardio %>% filter(Condition == cx_label) %>% pull(logFC)
  dox_vals <- complete_doxcardio %>% filter(Condition == dox_label) %>% pull(logFC)

  test <- tryCatch(wilcox.test(cx_vals, dox_vals), error = function(e) NULL)
  pval <- if (!is.null(test)) test$p.value else NA

  tibble(
    Condition = dox_label,
    p_value = signif(pval, 3),
    label = case_when(
      pval < 0.001 ~ "***",
      pval < 0.01  ~ "**",
      pval < 0.05  ~ "*",
      TRUE         ~ ""
    ),
    y_pos = max(c(cx_vals, dox_vals), na.rm = TRUE) + 0.5
  )
})

# ----------------- Final Boxplot -----------------
ggplot(complete_doxcardio, aes(x = Condition, y = logFC, fill = Drug)) +
  geom_boxplot(outlier.size = 0.6) +
  geom_text(data = wilcox_results,
            aes(x = Condition, y = y_pos, label = label),
            inherit.aes = FALSE,
            size = 4, vjust = 0) +
  scale_fill_manual(values = c("CX.5461" = "blue", "DOX" = "red")) +
  labs(
    title = "LogFC of DOX Cardiotoxicity Genes",
    x = "Condition",
    y = "logFC",
    fill = "Drug"
  ) +
  theme_bw(base_size = 14) +
  theme(
    plot.title = element_text(size = rel(1.5), hjust = 0.5),
    axis.title = element_text(size = 14),
    axis.text.x = element_text(angle = 45, hjust = 1, size = 10),
    legend.title = element_text(size = 14),
    legend.text = element_text(size = 12)
  )
| Version | Author | Date |
|---|---|---|
| 48c7dd9 | sayanpaul01 | 2025-05-13 |
📌 LogFC boxplots of Heart specific genes
# ----------------- Load Libraries -----------------
library(tidyverse)
library(org.Hs.eg.db)

# ----------------- DEG File Paths -----------------
deg_files <- list(
  "CX_0.1_3" = "data/DEGs/Toptable_CX_0.1_3.csv",
  "CX_0.1_24" = "data/DEGs/Toptable_CX_0.1_24.csv",
  "CX_0.1_48" = "data/DEGs/Toptable_CX_0.1_48.csv",
  "CX_0.5_3" = "data/DEGs/Toptable_CX_0.5_3.csv",
  "CX_0.5_24" = "data/DEGs/Toptable_CX_0.5_24.csv",
  "CX_0.5_48" = "data/DEGs/Toptable_CX_0.5_48.csv",
  "DOX_0.1_3" = "data/DEGs/Toptable_DOX_0.1_3.csv",
  "DOX_0.1_24" = "data/DEGs/Toptable_DOX_0.1_24.csv",
  "DOX_0.1_48" = "data/DEGs/Toptable_DOX_0.1_48.csv",
  "DOX_0.5_3" = "data/DEGs/Toptable_DOX_0.5_3.csv",
  "DOX_0.5_24" = "data/DEGs/Toptable_DOX_0.5_24.csv",
  "DOX_0.5_48" = "data/DEGs/Toptable_DOX_0.5_48.csv"
)

# ----------------- Load Heart-Specific Genes and Map to Entrez IDs -----------------
heart_genes <- read.csv("data/Human_Heart_Genes.csv", stringsAsFactors = FALSE)
heart_genes$Entrez_ID <- mapIds(
  org.Hs.eg.db,
  keys = heart_genes$Gene,
  column = "ENTREZID",
  keytype = "SYMBOL",
  multiVals = "first"
)
entrez_ids <- na.omit(heart_genes$Entrez_ID) %>% as.character()

# ----------------- Load and Filter DEGs -----------------
heart_data_list <- map2_dfr(deg_files, names(deg_files), function(file, label) {
  read_csv(file, show_col_types = FALSE) %>%
    mutate(
      Entrez_ID = as.character(Entrez_ID),
      Condition = label,
      Drug = ifelse(str_detect(label, "CX"), "CX.5461", "DOX")
    ) %>%
    filter(Entrez_ID %in% entrez_ids)
})

# ----------------- Create Full Gene × Condition Table -----------------
all_conditions <- names(deg_files)
all_combos <- crossing(
  Entrez_ID = entrez_ids,
  Condition = all_conditions
) %>%
  mutate(
    Drug = ifelse(str_detect(Condition, "CX"), "CX.5461", "DOX")
  )

# ----------------- Merge and Fill Missing Values -----------------
complete_heart <- all_combos %>%
  left_join(heart_data_list, by = c("Entrez_ID", "Condition", "Drug")) %>%
  mutate(
    logFC = ifelse(is.na(logFC), 0, logFC),
    adj.P.Val = ifelse(is.na(adj.P.Val), 1, adj.P.Val)
  )

# ----------------- Annotate Gene Symbols -----------------
complete_heart <- complete_heart %>%
  mutate(
    Gene = mapIds(org.Hs.eg.db, keys = Entrez_ID,
                  column = "SYMBOL", keytype = "ENTREZID", multiVals = "first")
  )

# ----------------- Order Conditions -----------------
complete_heart$Condition <- factor(complete_heart$Condition, levels = c(
  "CX_0.1_3", "CX_0.1_24", "CX_0.1_48",
  "CX_0.5_3", "CX_0.5_24", "CX_0.5_48",
  "DOX_0.1_3", "DOX_0.1_24", "DOX_0.1_48",
  "DOX_0.5_3", "DOX_0.5_24", "DOX_0.5_48"
))

# ----------------- Wilcoxon Test: CX vs DOX (matched) -----------------
condition_pairs <- tibble(
  cx = c("CX_0.1_3", "CX_0.1_24", "CX_0.1_48", "CX_0.5_3", "CX_0.5_24", "CX_0.5_48"),
  dox = c("DOX_0.1_3", "DOX_0.1_24", "DOX_0.1_48", "DOX_0.5_3", "DOX_0.5_24", "DOX_0.5_48")
)

wilcox_results <- map2_dfr(condition_pairs$cx, condition_pairs$dox, function(cx_label, dox_label) {
  cx_vals <- complete_heart %>% filter(Condition == cx_label) %>% pull(logFC)
  dox_vals <- complete_heart %>% filter(Condition == dox_label) %>% pull(logFC)

  test <- tryCatch(wilcox.test(cx_vals, dox_vals), error = function(e) NULL)
  pval <- if (!is.null(test)) test$p.value else NA

  tibble(
    Condition = dox_label,
    p_value = signif(pval, 3),
    label = case_when(
      pval < 0.001 ~ "***",
      pval < 0.01  ~ "**",
      pval < 0.05  ~ "*",
      TRUE         ~ ""
    ),
    y_pos = max(c(cx_vals, dox_vals), na.rm = TRUE) + 0.5
  )
})

# ----------------- Final Boxplot -----------------
ggplot(complete_heart, aes(x = Condition, y = logFC, fill = Drug)) +
  geom_boxplot(outlier.size = 0.6) +
  geom_text(data = wilcox_results,
            aes(x = Condition, y = y_pos, label = label),
            inherit.aes = FALSE,
            size = 4, vjust = 0) +
  scale_fill_manual(values = c("CX.5461" = "blue", "DOX" = "red")) +
  labs(
    title = "LogFC of Heart-Specific Genes",
    x = "Condition",
    y = "logFC",
    fill = "Drug"
  ) +
  theme_bw(base_size = 14) +
  theme(
    plot.title = element_text(size = rel(1.5), hjust = 0.5),
    axis.title = element_text(size = 14),
    axis.text.x = element_text(angle = 45, hjust = 1, size = 10),
    legend.title = element_text(size = 14),
    legend.text = element_text(size = 12)
  )
📌 Atrial fibrillation gene expression changes between CX5461 and DOX
library(tidyverse)
library(ggfortify)
library(cluster)
library(edgeR)
library(limma)
library(Homo.sapiens)
library(BiocParallel)
library(qvalue)
library(pheatmap)
library(clusterProfiler)
library(AnnotationDbi)
library(org.Hs.eg.db)
library(RColorBrewer)
library(readr)
library(TxDb.Hsapiens.UCSC.hg38.knownGene)
library(ComplexHeatmap)
library(circlize)
library(grid)
library(reshape2)
library(dplyr)

# Load UCSC transcript database
txdb <- TxDb.Hsapiens.UCSC.hg38.knownGene

# Load DEGs Data
CX_0.1_3 <- read.csv("data/DEGs/Toptable_CX_0.1_3.csv")
CX_0.1_24 <- read.csv("data/DEGs/Toptable_CX_0.1_24.csv")
CX_0.1_48 <- read.csv("data/DEGs/Toptable_CX_0.1_48.csv")
CX_0.5_3 <- read.csv("data/DEGs/Toptable_CX_0.5_3.csv")
CX_0.5_24 <- read.csv("data/DEGs/Toptable_CX_0.5_24.csv")
CX_0.5_48 <- read.csv("data/DEGs/Toptable_CX_0.5_48.csv")

DOX_0.1_3 <- read.csv("data/DEGs/Toptable_DOX_0.1_3.csv")
DOX_0.1_24 <- read.csv("data/DEGs/Toptable_DOX_0.1_24.csv")
DOX_0.1_48 <- read.csv("data/DEGs/Toptable_DOX_0.1_48.csv")
DOX_0.5_3 <- read.csv("data/DEGs/Toptable_DOX_0.5_3.csv")
DOX_0.5_24 <- read.csv("data/DEGs/Toptable_DOX_0.5_24.csv")
DOX_0.5_48 <- read.csv("data/DEGs/Toptable_DOX_0.5_48.csv")

Entrez_IDs <- c(
  3425, 53834, 9464, 79658, 55876, 3781, 9472, 11017, 64395, 23353,
  57794, 79591, 2702, 51306, 857, 10418, 9644, 115509, 89797, 10728,
  282996, 8497, 5695, 9026, 57666, 143384, 5883, 90102, 84909, 221037,
  29119, 79933, 391, 81575, 8738, 5396, 26010, 744, 56981, 80724,
  5781, 6910, 4598, 79068, 2250, 56978, 3752, 5208, 9736, 26778,
  80315, 64374, 79159, 11078, 5308, 3782, 10654, 79776, 6310, 8082,
  2995, 23224, 79741, 5708, 26136, 9967, 84033, 9148, 29982, 81488,
  1788, 9208, 2908, 1021, 5339, 5727, 23118, 10090, 57585, 221154,
  1073, 29998, 817, 858, 3486, 5747, 2104, 55105, 4194, 3570,
  1607, 6586, 5570, 2070, 27145, 4646, 3159, 9748, 79991, 221035,
  5033, 80212, 196385, 79600, 11046, 54014, 151636, 64778, 92597, 3983,
  7090, 9267, 7273, 26018, 9948, 2131, 55870, 5523, 5318, 6239,
  3480, 55777, 2066, 11165, 2028, 57619, 2690, 23414, 55818, 84700,
  28965, 80204, 463, 5108, 222553, 387119, 28981, 11113, 10301, 995,
  23030, 2697, 996, 339500, 54805, 9960, 91404, 145781, 100820829, 84542,
  2176, 51684, 9513, 7473, 4666, 23150, 5915, 5062, 4016, 23039,
  159686, 1839, 5201, 93166, 64753, 29959, 5496, 23245, 5069, 56916,
  92344, 23092, 3992, 9415, 10554, 7456, 9570, 57178, 23143, 161176,
  5424, 2034, 10277, 11278, 79803, 6653, 4756, 132660, 5430, 9031,
  57158, 285761, 8110, 387700, 1829, 4126, 7323, 51308, 7332, 6598,
  3757, 6187, 6660, 10529, 6920, 115286, 8451, 8943, 4137, 7514,
  4801, 9709, 23177, 8671, 29915, 26207, 3680, 490, 493856, 58489,
  54897, 4625, 22955, 84952, 10221, 2263, 84641, 4892, 1026, 84650,
  8382, 221656, 2969, 144453, 117177, 2626, 8476, 161882, 51807, 4624,
  9612, 55795, 51043, 144348, 51232, 8729, 3899, 11155, 23316, 79006,
  146330, 6403, 6331, 4300, 427, 845, 3313, 113622, 5789, 376132,
  29841, 8462, 203859, 401397, 5506, 55521, 5819, 4059, 6934, 57727,
  23066, 79568, 83478, 10087, 9586, 222194, 10466, 10499, 58499, 79720,
  4772, 10794, 125919, 602, 27332, 59345, 340359, 3705, 64710, 57801,
  10818, 143684, 149281, 55013, 23095, 93649, 84034, 23347, 440926, 11124,
  23293, 51426, 832, 7068, 57646, 152002, 7531, 1398, 100101267, 221937,
  26873, 3709, 10576, 27040, 201176, 284403, 307, 6525, 5387, 1808,
  114907, 1952, 4091, 5096, 23451, 51207, 142891, 4084, 3797, 1185,
  5334, 217, 2042, 7781, 253461, 152404, 2992, 153478, 6695, 26249,
  662, 23036, 22852, 23411, 23387, 6786, 7690, 10021, 8925, 5595,
  63892, 23466, 11149, 139411, 755, 55347, 22820, 55111, 84444, 6258,
  57623, 1387, 3762, 5861, 3339, 114822, 129787, 196528, 54437, 10395,
  4023, 5095, 894, 3156, 1877, 283871, 2673, 23157, 10512, 2258,
  79750, 84665, 26091, 5978, 8751, 79695, 2768, 155382, 84163, 7709,
  4092, 1837, 2064, 4629, 55122, 8882, 150962, 23013, 8742, 489,
  201134, 55114, 84264, 64428, 4089, 861, 7422
)


# Subset the toptable based on the entrez IDs and select specific columns

subset_toptable1 <- CX_0.1_3[CX_0.1_3$Entrez_ID %in% Entrez_IDs, c("Entrez_ID", "logFC", "adj.P.Val")]


subset_toptable2 <- CX_0.1_24[CX_0.1_24$Entrez_ID %in% Entrez_IDs, c("Entrez_ID", "logFC", "adj.P.Val")]


subset_toptable3 <- CX_0.1_48[CX_0.1_48$Entrez_ID %in% Entrez_IDs, c("Entrez_ID", "logFC", "adj.P.Val")]


subset_toptable3 <- CX_0.1_48[CX_0.1_48$Entrez_ID %in% Entrez_IDs, c("Entrez_ID", "logFC", "adj.P.Val")]

subset_toptable4 <- CX_0.5_3[CX_0.5_3$Entrez_ID %in% Entrez_IDs, c("Entrez_ID", "logFC", "adj.P.Val")]

subset_toptable5 <- CX_0.5_24[CX_0.5_24$Entrez_ID %in% Entrez_IDs, c("Entrez_ID", "logFC", "adj.P.Val")]

subset_toptable6 <- CX_0.5_48[CX_0.5_48$Entrez_ID %in% Entrez_IDs, c("Entrez_ID", "logFC", "adj.P.Val")]

subset_toptable7 <- DOX_0.1_3[DOX_0.1_3$Entrez_ID %in% Entrez_IDs, c("Entrez_ID", "logFC", "adj.P.Val")]

subset_toptable8 <- DOX_0.1_24[DOX_0.1_24$Entrez_ID %in% Entrez_IDs, c("Entrez_ID", "logFC", "adj.P.Val")]

subset_toptable9 <- DOX_0.1_48[DOX_0.1_48$Entrez_ID %in% Entrez_IDs, c("Entrez_ID", "logFC", "adj.P.Val")]

subset_toptable10 <- DOX_0.5_3[DOX_0.5_3$Entrez_ID %in% Entrez_IDs, c("Entrez_ID", "logFC", "adj.P.Val")]

subset_toptable11 <- DOX_0.5_24[DOX_0.5_24$Entrez_ID %in% Entrez_IDs, c("Entrez_ID", "logFC", "adj.P.Val")]

subset_toptable12 <- DOX_0.5_48[DOX_0.5_48$Entrez_ID %in% Entrez_IDs, c("Entrez_ID", "logFC", "adj.P.Val")]

# Function to add columns and combine data
add_metadata <- function(data, drug, conc, time) {
  data %>%
    mutate(Drug = drug, Conc = conc, Time = time)
}

# Add metadata and combine all subsets
combined_data <- bind_rows(
  add_metadata(subset_toptable1, "CX", 0.1, 3),
  add_metadata(subset_toptable2, "CX", 0.1, 24),
  add_metadata(subset_toptable3, "CX", 0.1, 48),
  add_metadata(subset_toptable4, "CX", 0.5, 3),
  add_metadata(subset_toptable5, "CX", 0.5, 24),
  add_metadata(subset_toptable6, "CX", 0.5, 48),
  add_metadata(subset_toptable7, "DOX", 0.1, 3),
  add_metadata(subset_toptable8, "DOX", 0.1, 24),
  add_metadata(subset_toptable9, "DOX", 0.1, 48),
  add_metadata(subset_toptable10, "DOX", 0.5, 3),
  add_metadata(subset_toptable11, "DOX", 0.5, 24),
  add_metadata(subset_toptable12, "DOX", 0.5, 48)
)

# Convert Entrez IDs to Gene symbols
combined_data <- combined_data %>%
  mutate(Gene = mapIds(
    org.Hs.eg.db,
    keys = as.character(Entrez_ID),
    column = "SYMBOL",
    keytype = "ENTREZID",
    multiVals = "first"
  ))

# Reorder columns
final_data <- dplyr::select(combined_data, Entrez_ID, Gene, logFC, adj.P.Val, Drug, Conc, Time)

# Assuming your dataframe is named data
# Add a column for significance stars
final_data <- final_data %>%
  mutate(Significance = ifelse(adj.P.Val < 0.05, "*", ""))

# Create a matrix for the heatmap (logFC values)
logFC_matrix <- acast(final_data, Gene ~ paste(Drug, Conc, Time, sep = "_"), value.var = "logFC")

# Create a matrix for the significance annotations
signif_matrix <- acast(final_data, Gene ~ paste(Drug, Conc, Time, sep = "_"), value.var = "Significance")

# Split column names into Drug, Conc, and Time
colnames_split <- strsplit(colnames(logFC_matrix), "_")
drug <- sapply(colnames_split, function(x) x[1])
conc <- sapply(colnames_split, function(x) x[2])
time <- sapply(colnames_split, function(x) x[3])

# Create the desired column order: CX 0.1 3hr, CX 0.5 3hr, CX 0.1 24hr, CX 0.5 24hr, CX 0.1 48h, CX 0.5 48h,
# DOX 0.1 3hr, DOX 0.5 3hr, DOX 0.1 24hr, DOX 0.5 24hr, DOX 0.1 48h, DOX 0.5 48h
desired_order <- c("CX_0.1_3", "CX_0.5_3", "CX_0.1_24", "CX_0.5_24", "CX_0.1_48", "CX_0.5_48",
                   "DOX_0.1_3", "DOX_0.5_3", "DOX_0.1_24", "DOX_0.5_24", "DOX_0.1_48", "DOX_0.5_48")

# Reorder columns in the matrix based on the desired order
column_names <- paste(drug, conc, time, sep = "_")
column_order <- match(desired_order, column_names)
logFC_matrix <- logFC_matrix[, column_order]
signif_matrix <- signif_matrix[, column_order]
drug <- drug[column_order]
conc <- conc[column_order]
time <- time[column_order]

# Prepare annotations matching the column structure
ha_top <- HeatmapAnnotation(
  Drug = drug,
  Conc = conc,
  Time = time,
  col = list(Drug = c("CX" = "blue", "DOX" = "red"),
             Conc = c("0.1" = "lightgreen", "0.5" = "darkgreen"),
             Time = c("3" = "yellow", "24" = "orange", "48" = "purple")),
  annotation_height = unit(c(2, 2, 2), "cm")
)

# Create the heatmap
heatmap <- Heatmap(logFC_matrix, name = "logFC", top_annotation = ha_top,
                   cell_fun = function(j, i, x, y, width, height, fill) {
                     grid.text(signif_matrix[i, j], x, y, gp = gpar(fontsize = 10))
                   },
                   show_row_names = TRUE, show_column_names = FALSE,
                   column_title = "Genes in Atrial fibrillation GWAS associated loci\nin response to CX5461 and DOX",
                   column_title_gp = gpar(fontsize = 16, fontface = "bold"),
                   cluster_columns = FALSE)  # Disable column clustering

# Draw the heatmap
draw(heatmap, heatmap_legend_side = "right", annotation_legend_side = "right")
| Version | Author | Date |
|---|---|---|
| 92099e7 | sayanpaul01 | 2025-05-08 |
📌 LogFC boxplots of Atrial fibrillation GWAS genes
# ----------------- Load Libraries -----------------
library(tidyverse)
library(org.Hs.eg.db)

# ----------------- DEG File Paths -----------------
deg_files <- list(
  "CX_0.1_3" = "data/DEGs/Toptable_CX_0.1_3.csv",
  "CX_0.1_24" = "data/DEGs/Toptable_CX_0.1_24.csv",
  "CX_0.1_48" = "data/DEGs/Toptable_CX_0.1_48.csv",
  "CX_0.5_3" = "data/DEGs/Toptable_CX_0.5_3.csv",
  "CX_0.5_24" = "data/DEGs/Toptable_CX_0.5_24.csv",
  "CX_0.5_48" = "data/DEGs/Toptable_CX_0.5_48.csv",
  "DOX_0.1_3" = "data/DEGs/Toptable_DOX_0.1_3.csv",
  "DOX_0.1_24" = "data/DEGs/Toptable_DOX_0.1_24.csv",
  "DOX_0.1_48" = "data/DEGs/Toptable_DOX_0.1_48.csv",
  "DOX_0.5_3" = "data/DEGs/Toptable_DOX_0.5_3.csv",
  "DOX_0.5_24" = "data/DEGs/Toptable_DOX_0.5_24.csv",
  "DOX_0.5_48" = "data/DEGs/Toptable_DOX_0.5_48.csv"
)

# ----------------- AF Entrez IDs -----------------
entrez_ids <- c(
  3425, 53834, 9464, 79658, 55876, 3781, 9472, 11017, 64395, 23353,
  57794, 79591, 2702, 51306, 857, 10418, 9644, 115509, 89797, 10728,
  282996, 8497, 5695, 9026, 57666, 143384, 5883, 90102, 84909, 221037,
  29119, 79933, 391, 81575, 8738, 5396, 26010, 744, 56981, 80724,
  5781, 6910, 4598, 79068, 2250, 56978, 3752, 5208, 9736, 26778,
  80315, 64374, 79159, 11078, 5308, 3782, 10654, 79776, 6310, 8082,
  2995, 23224, 79741, 5708, 26136, 9967, 84033, 9148, 29982, 81488,
  1788, 9208, 2908, 1021, 5339, 5727, 23118, 10090, 57585, 221154,
  1073, 29998, 817, 858, 3486, 5747, 2104, 55105, 4194, 3570,
  1607, 6586, 5570, 2070, 27145, 4646, 3159, 9748, 79991, 221035,
  5033, 80212, 196385, 79600, 11046, 54014, 151636, 64778, 92597, 3983,
  7090, 9267, 7273, 26018, 9948, 2131, 55870, 5523, 5318, 6239,
  3480, 55777, 2066, 11165, 2028, 57619, 2690, 23414, 55818, 84700,
  28965, 80204, 463, 5108, 222553, 387119, 28981, 11113, 10301, 995,
  23030, 2697, 996, 339500, 54805, 9960, 91404, 145781, 100820829, 84542,
  2176, 51684, 9513, 7473, 4666, 23150, 5915, 5062, 4016, 23039,
  159686, 1839, 5201, 93166, 64753, 29959, 5496, 23245, 5069, 56916,
  92344, 23092, 3992, 9415, 10554, 7456, 9570, 57178, 23143, 161176,
  5424, 2034, 10277, 11278, 79803, 6653, 4756, 132660, 5430, 9031,
  57158, 285761, 8110, 387700, 1829, 4126, 7323, 51308, 7332, 6598,
  3757, 6187, 6660, 10529, 6920, 115286, 8451, 8943, 4137, 7514,
  4801, 9709, 23177, 8671, 29915, 26207, 3680, 490, 493856, 58489,
  54897, 4625, 22955, 84952, 10221, 2263, 84641, 4892, 1026, 84650,
  8382, 221656, 2969, 144453, 117177, 2626, 8476, 161882, 51807, 4624,
  9612, 55795, 51043, 144348, 51232, 8729, 3899, 11155, 23316, 79006,
  146330, 6403, 6331, 4300, 427, 845, 3313, 113622, 5789, 376132,
  29841, 8462, 203859, 401397, 5506, 55521, 5819, 4059, 6934, 57727,
  23066, 79568, 83478, 10087, 9586, 222194, 10466, 10499, 58499, 79720,
  4772, 10794, 125919, 602, 27332, 59345, 340359, 3705, 64710, 57801,
  10818, 143684, 149281, 55013, 23095, 93649, 84034, 23347, 440926, 11124,
  23293, 51426, 832, 7068, 57646, 152002, 7531, 1398, 100101267, 221937,
  26873, 3709, 10576, 27040, 201176, 284403, 307, 6525, 5387, 1808,
  114907, 1952, 4091, 5096, 23451, 51207, 142891, 4084, 3797, 1185,
  5334, 217, 2042, 7781, 253461, 152404, 2992, 153478, 6695, 26249,
  662, 23036, 22852, 23411, 23387, 6786, 7690, 10021, 8925, 5595,
  63892, 23466, 11149, 139411, 755, 55347, 22820, 55111, 84444, 6258,
  57623, 1387, 3762, 5861, 3339, 114822, 129787, 196528, 54437, 10395,
  4023, 5095, 894, 3156, 1877, 283871, 2673, 23157, 10512, 2258,
  79750, 84665, 26091, 5978, 8751, 79695, 2768, 155382, 84163, 7709,
  4092, 1837, 2064, 4629, 55122, 8882, 150962, 23013, 8742, 489,
  201134, 55114, 84264, 64428, 4089, 861, 7422
) %>% as.character()

# ----------------- Load and Filter DEGs -----------------
af_data_list <- map2_dfr(deg_files, names(deg_files), function(file, label) {
  read_csv(file, show_col_types = FALSE) %>%
    mutate(
      Entrez_ID = as.character(Entrez_ID),
      Condition = label,
      Drug = ifelse(str_detect(label, "CX"), "CX.5461", "DOX")
    ) %>%
    filter(Entrez_ID %in% entrez_ids)
})

# ----------------- Complete Combinations -----------------
all_conditions <- names(deg_files)
all_combos <- crossing(
  Entrez_ID = entrez_ids,
  Condition = all_conditions
) %>%
  mutate(
    Drug = ifelse(str_detect(Condition, "CX"), "CX.5461", "DOX")
  )

# ----------------- Merge with Data -----------------
complete_af <- all_combos %>%
  left_join(af_data_list, by = c("Entrez_ID", "Condition", "Drug")) %>%
  mutate(
    logFC = ifelse(is.na(logFC), 0, logFC),
    adj.P.Val = ifelse(is.na(adj.P.Val), 1, adj.P.Val)
  )

# ----------------- Gene Symbol Mapping -----------------
complete_af <- complete_af %>%
  mutate(
    Gene = mapIds(org.Hs.eg.db, keys = Entrez_ID,
                  column = "SYMBOL", keytype = "ENTREZID", multiVals = "first")
  )

# ----------------- Order Conditions -----------------
complete_af$Condition <- factor(complete_af$Condition, levels = c(
  "CX_0.1_3", "CX_0.1_24", "CX_0.1_48",
  "CX_0.5_3", "CX_0.5_24", "CX_0.5_48",
  "DOX_0.1_3", "DOX_0.1_24", "DOX_0.1_48",
  "DOX_0.5_3", "DOX_0.5_24", "DOX_0.5_48"
))

# ----------------- Wilcoxon Tests -----------------
condition_pairs <- tibble(
  cx = c("CX_0.1_3", "CX_0.1_24", "CX_0.1_48", "CX_0.5_3", "CX_0.5_24", "CX_0.5_48"),
  dox = c("DOX_0.1_3", "DOX_0.1_24", "DOX_0.1_48", "DOX_0.5_3", "DOX_0.5_24", "DOX_0.5_48")
)

wilcox_results <- map2_dfr(condition_pairs$cx, condition_pairs$dox, function(cx_label, dox_label) {
  cx_vals <- complete_af %>% filter(Condition == cx_label) %>% pull(logFC)
  dox_vals <- complete_af %>% filter(Condition == dox_label) %>% pull(logFC)

  test <- tryCatch(wilcox.test(cx_vals, dox_vals), error = function(e) NULL)
  pval <- if (!is.null(test)) test$p.value else NA

  tibble(
    Condition = dox_label,
    p_value = signif(pval, 3),
    label = case_when(
      pval < 0.001 ~ "***",
      pval < 0.01  ~ "**",
      pval < 0.05  ~ "*",
      TRUE         ~ ""
    ),
    y_pos = max(c(cx_vals, dox_vals), na.rm = TRUE) + 0.5
  )
})

# ----------------- Final Plot -----------------
ggplot(complete_af, aes(x = Condition, y = logFC, fill = Drug)) +
  geom_boxplot(outlier.size = 0.6) +
  geom_text(data = wilcox_results,
            aes(x = Condition, y = y_pos, label = label),
            inherit.aes = FALSE,
            size = 4, vjust = 0) +
  scale_fill_manual(values = c("CX.5461" = "blue", "DOX" = "red")) +
  labs(
    title = "LogFC of AF-Associated Genes",
    x = "Condition",
    y = "logFC",
    fill = "Drug"
  ) +
  theme_bw(base_size = 14) +
  theme(
    plot.title = element_text(size = rel(1.5), hjust = 0.5),
    axis.title = element_text(size = 14),
    axis.text.x = element_text(angle = 45, hjust = 1, size = 10),
    legend.title = element_text(size = 14),
    legend.text = element_text(size = 12)
  )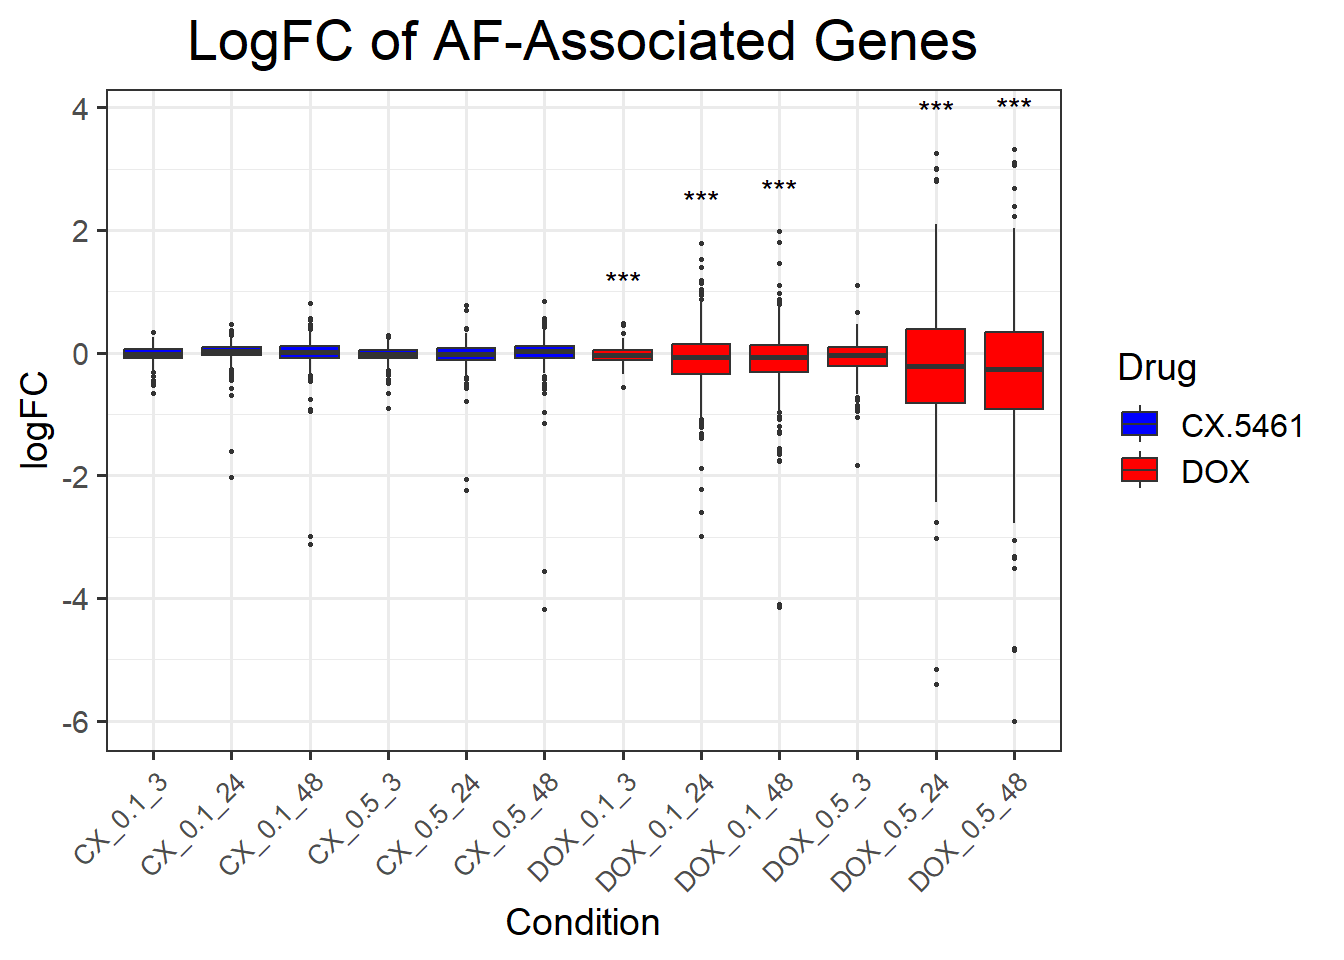
| Version | Author | Date |
|---|---|---|
| 48c7dd9 | sayanpaul01 | 2025-05-13 |
📌 Heart Failure gene expression changes between CX5461 and DOX
# Load necessary libraries
library(tidyverse)
library(ComplexHeatmap)
library(circlize)
library(org.Hs.eg.db)
library(reshape2)
library(grid)

# Set 30 Entrez IDs
Entrez_IDs <- c(
  9709, 8882, 4023, 29959, 5496, 3992, 9415, 5308, 1026, 54437,
  79068, 10221, 9031, 1187, 1952, 3705, 84722, 7273, 23293, 155382,
  9531, 602, 27258, 84163, 81846, 79933, 56911, 64753, 93210, 1021
)

# rsID mapping for row annotation
rsid_mapping <- data.frame(
  Entrez_ID = Entrez_IDs,
  rsID = c("rs247617", "rs964184", "rs765547", "rs1728918", "rs1728918", "rs174547",
           "rs174547", "rs59788391", "rs3176326", "rs7632505", "rs11642015", "rs2980853",
           "rs2074755", "rs28579893", "rs602633", "rs4905014", "rs602633", "rs2562845",
           "rs216193", "rs799165", "rs17617337", "rs4803750", "rs11710541", "rs202209188",
           "rs2957657", "rs34163229", "rs56968346", "rs3807132", "rs12150603", "rs2282979"
  )
)

# Load DEGs
load_deg <- function(name) {
  read.csv(paste0("data/DEGs/Toptable_", name, ".csv"))
}
samples <- c("CX_0.1_3", "CX_0.1_24", "CX_0.1_48", "CX_0.5_3", "CX_0.5_24", "CX_0.5_48",
             "DOX_0.1_3", "DOX_0.1_24", "DOX_0.1_48", "DOX_0.5_3", "DOX_0.5_24", "DOX_0.5_48")
deg_list <- lapply(samples, load_deg)
names(deg_list) <- samples

# Subset and annotate
# Subset and annotate
get_subset <- function(df, name) {
  parts <- strsplit(name, "_")[[1]]
  df %>%
    filter(Entrez_ID %in% Entrez_IDs) %>%
    dplyr::select(Entrez_ID, logFC, adj.P.Val) %>%
    mutate(Drug = parts[1], Conc = parts[2], Time = parts[3])
}
combined_data <- bind_rows(mapply(get_subset, deg_list, names(deg_list), SIMPLIFY = FALSE))

# Add gene symbol and significance
combined_data <- combined_data %>%
  mutate(Gene = mapIds(org.Hs.eg.db, keys = as.character(Entrez_ID),
                       column = "SYMBOL", keytype = "ENTREZID", multiVals = "first"),
         Significance = ifelse(adj.P.Val < 0.05, "*", ""))

# Join rsID mapping
combined_data <- left_join(combined_data, rsid_mapping, by = "Entrez_ID")

# Preserve gene order
ordered_genes <- combined_data %>%
  distinct(Entrez_ID, Gene) %>%
  arrange(factor(Entrez_ID, levels = Entrez_IDs)) %>%
  pull(Gene)

# Create logFC and significance matrices
logFC_matrix <- acast(combined_data, Gene ~ paste(Drug, Conc, Time, sep = "_"), value.var = "logFC")
signif_matrix <- acast(combined_data, Gene ~ paste(Drug, Conc, Time, sep = "_"), value.var = "Significance")
logFC_matrix <- logFC_matrix[ordered_genes, ]
signif_matrix <- signif_matrix[ordered_genes, ]

# Desired order: group 0.1 first, then 0.5 for both drugs
desired_order <- c("CX_0.1_3", "CX_0.1_24", "CX_0.1_48", "CX_0.5_3", "CX_0.5_24", "CX_0.5_48",
                   "DOX_0.1_3", "DOX_0.1_24", "DOX_0.1_48", "DOX_0.5_3", "DOX_0.5_24", "DOX_0.5_48")
logFC_matrix <- logFC_matrix[, desired_order]
signif_matrix <- signif_matrix[, desired_order]

# Split column info
split_cols <- strsplit(colnames(logFC_matrix), "_")
drug <- sapply(split_cols, `[`, 1)
conc <- sapply(split_cols, `[`, 2)
time <- sapply(split_cols, `[`, 3)

# Annotations
ha_top <- HeatmapAnnotation(
  Drug = drug,
  Conc = conc,
  Time = time,
  col = list(
    Drug = c("CX" = "blue", "DOX" = "red"),
    Conc = c("0.1" = "lightgreen", "0.5" = "darkgreen"),
    Time = c("3" = "yellow", "24" = "orange", "48" = "purple")
  ),
  annotation_height = unit(c(2, 2, 2), "cm")
)

# rsID annotation
rsid_vector <- combined_data %>%
  distinct(Gene, rsID) %>%
  filter(Gene %in% ordered_genes) %>%
  arrange(match(Gene, ordered_genes)) %>%
  pull(rsID)

ha_left <- rowAnnotation(
  rsID = anno_text(rsid_vector, location = 0, just = "left", gp = gpar(fontsize = 9)),
  annotation_name_side = "top",
  width = unit(5, "cm")
)

# Heatmap
Heatmap(logFC_matrix,
        name = "logFC",
        top_annotation = ha_top,
        left_annotation = ha_left,
        show_row_names = TRUE,
        show_column_names = FALSE,
        cluster_columns = FALSE,
        cluster_rows = FALSE,
        cell_fun = function(j, i, x, y, width, height, fill) {
          grid.text(signif_matrix[i, j], x, y, gp = gpar(fontsize = 10))
        },
        column_title = "Heart Failure GWAS Genes: Response to CX-5461 and DOX",
        column_title_gp = gpar(fontsize = 16, fontface = "bold")
)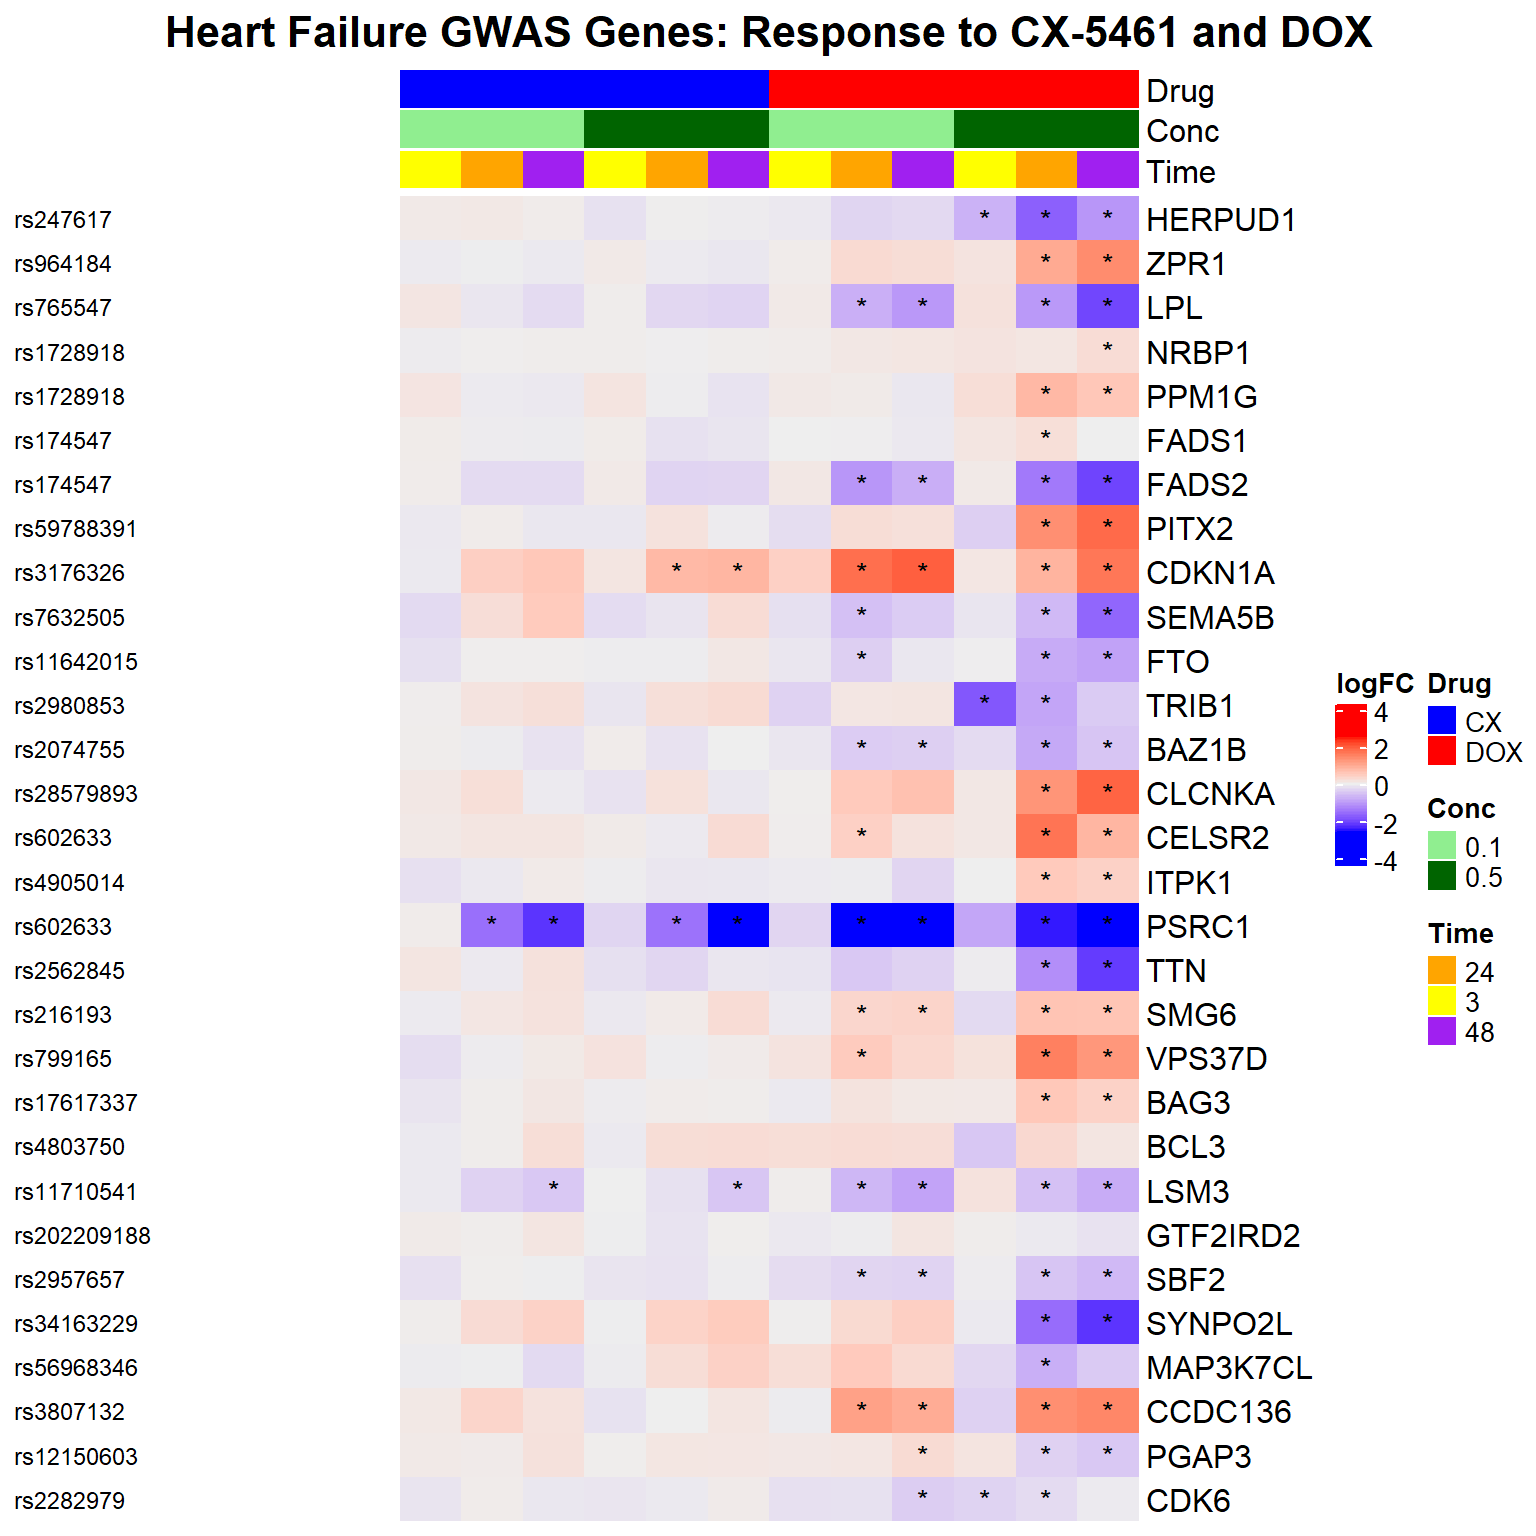
| Version | Author | Date |
|---|---|---|
| 92099e7 | sayanpaul01 | 2025-05-08 |
📌 LogFC boxplots of Heart Failure GWAS genes
# ----------------- Load Libraries -----------------
library(tidyverse)
library(org.Hs.eg.db)

# ----------------- DEG File Paths -----------------
deg_files <- list(
  "CX_0.1_3" = "data/DEGs/Toptable_CX_0.1_3.csv",
  "CX_0.1_24" = "data/DEGs/Toptable_CX_0.1_24.csv",
  "CX_0.1_48" = "data/DEGs/Toptable_CX_0.1_48.csv",
  "CX_0.5_3" = "data/DEGs/Toptable_CX_0.5_3.csv",
  "CX_0.5_24" = "data/DEGs/Toptable_CX_0.5_24.csv",
  "CX_0.5_48" = "data/DEGs/Toptable_CX_0.5_48.csv",
  "DOX_0.1_3" = "data/DEGs/Toptable_DOX_0.1_3.csv",
  "DOX_0.1_24" = "data/DEGs/Toptable_DOX_0.1_24.csv",
  "DOX_0.1_48" = "data/DEGs/Toptable_DOX_0.1_48.csv",
  "DOX_0.5_3" = "data/DEGs/Toptable_DOX_0.5_3.csv",
  "DOX_0.5_24" = "data/DEGs/Toptable_DOX_0.5_24.csv",
  "DOX_0.5_48" = "data/DEGs/Toptable_DOX_0.5_48.csv"
)

# ----------------- Heart Failure Entrez IDs -----------------
entrez_ids <- c(
  9709, 8882, 4023, 29959, 5496, 3992, 9415, 5308, 1026, 54437, 79068, 10221,
  9031, 1187, 1952, 3705, 84722, 7273, 23293, 155382, 9531, 602, 27258, 84163,
  81846, 79933, 56911, 64753, 93210, 1021, 283450, 5998, 57602, 114991, 7073,
  3156, 100101267, 22996, 285025, 11080, 11124, 54810, 7531, 27241, 4774, 57794,
  463, 91319, 6598, 9640, 2186, 26010, 80816, 571, 88, 51652, 64788, 90523, 2969,
  7781, 80777, 10725, 23387, 817, 134728, 8842, 949, 6934, 129787, 10327, 202052,
  2318, 5578, 6801, 6311, 10019, 80724, 217, 84909, 388591, 55101, 9839, 27161,
  5310, 387119, 4641, 5587, 55188, 222553, 9960, 22852, 10087, 9570, 54497,
  200942, 26249, 4137, 375056, 5409, 64116, 8291, 22876, 339855, 4864, 5142,
  221692, 55023, 51426, 6146, 84251, 8189, 27332, 57099, 1869, 1112, 23327,
  11264, 6001
) %>% as.character()

# ----------------- Load and Filter DEGs -----------------
hf_data_list <- map2_dfr(deg_files, names(deg_files), function(file, label) {
  read_csv(file, show_col_types = FALSE) %>%
    mutate(
      Entrez_ID = as.character(Entrez_ID),
      Condition = label,
      Drug = ifelse(str_detect(label, "CX"), "CX.5461", "DOX")
    ) %>%
    filter(Entrez_ID %in% entrez_ids)
})

# ----------------- Complete Combinations -----------------
all_conditions <- names(deg_files)
all_combos <- crossing(
  Entrez_ID = entrez_ids,
  Condition = all_conditions
) %>%
  mutate(
    Drug = ifelse(str_detect(Condition, "CX"), "CX.5461", "DOX")
  )

# ----------------- Merge with Data -----------------
complete_hf <- all_combos %>%
  left_join(hf_data_list, by = c("Entrez_ID", "Condition", "Drug")) %>%
  mutate(
    logFC = ifelse(is.na(logFC), 0, logFC),
    adj.P.Val = ifelse(is.na(adj.P.Val), 1, adj.P.Val)
  )

# ----------------- Gene Symbol Mapping -----------------
complete_hf <- complete_hf %>%
  mutate(
    Gene = mapIds(org.Hs.eg.db, keys = Entrez_ID,
                  column = "SYMBOL", keytype = "ENTREZID", multiVals = "first")
  )

# ----------------- Order Conditions -----------------
complete_hf$Condition <- factor(complete_hf$Condition, levels = c(
  "CX_0.1_3", "CX_0.1_24", "CX_0.1_48",
  "CX_0.5_3", "CX_0.5_24", "CX_0.5_48",
  "DOX_0.1_3", "DOX_0.1_24", "DOX_0.1_48",
  "DOX_0.5_3", "DOX_0.5_24", "DOX_0.5_48"
))

# ----------------- Wilcoxon Tests -----------------
condition_pairs <- tibble(
  cx = c("CX_0.1_3", "CX_0.1_24", "CX_0.1_48", "CX_0.5_3", "CX_0.5_24", "CX_0.5_48"),
  dox = c("DOX_0.1_3", "DOX_0.1_24", "DOX_0.1_48", "DOX_0.5_3", "DOX_0.5_24", "DOX_0.5_48")
)

wilcox_results <- map2_dfr(condition_pairs$cx, condition_pairs$dox, function(cx_label, dox_label) {
  cx_vals <- complete_hf %>% filter(Condition == cx_label) %>% pull(logFC)
  dox_vals <- complete_hf %>% filter(Condition == dox_label) %>% pull(logFC)

  test <- tryCatch(wilcox.test(cx_vals, dox_vals), error = function(e) NULL)
  pval <- if (!is.null(test)) test$p.value else NA

  tibble(
    Condition = dox_label,
    p_value = signif(pval, 3),
    label = case_when(
      pval < 0.001 ~ "***",
      pval < 0.01  ~ "**",
      pval < 0.05  ~ "*",
      TRUE         ~ ""
    ),
    y_pos = max(c(cx_vals, dox_vals), na.rm = TRUE) + 0.5
  )
})

# ----------------- Final Plot -----------------
ggplot(complete_hf, aes(x = Condition, y = logFC, fill = Drug)) +
  geom_boxplot(outlier.size = 0.6) +
  geom_text(data = wilcox_results,
            aes(x = Condition, y = y_pos, label = label),
            inherit.aes = FALSE,
            size = 4, vjust = 0) +
  scale_fill_manual(values = c("CX.5461" = "blue", "DOX" = "red")) +
  labs(
    title = "LogFC of Heart Failure-Associated Genes",
    x = "Condition",
    y = "logFC",
    fill = "Drug"
  ) +
  theme_bw(base_size = 14) +
  theme(
    plot.title = element_text(size = rel(1.5), hjust = 0.5),
    axis.title = element_text(size = 14),
    axis.text.x = element_text(angle = 45, hjust = 1, size = 10),
    legend.title = element_text(size = 14),
    legend.text = element_text(size = 12)
  )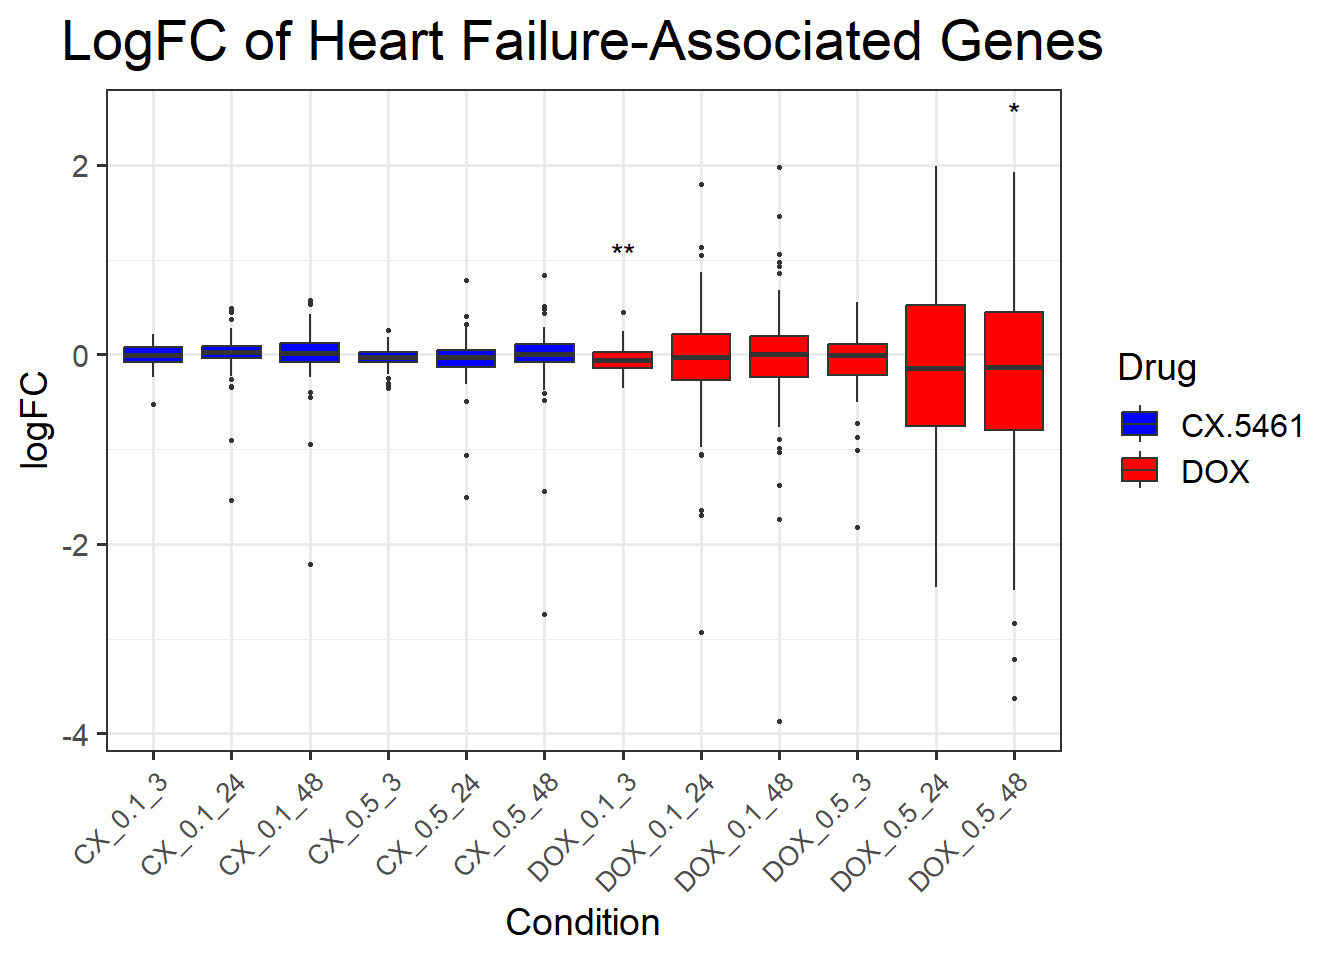
| Version | Author | Date |
|---|---|---|
| 48c7dd9 | sayanpaul01 | 2025-05-13 |
sessionInfo()R version 4.3.0 (2023-04-21 ucrt)
Platform: x86_64-w64-mingw32/x64 (64-bit)
Running under: Windows 11 x64 (build 26100)
Matrix products: default
locale:
[1] LC_COLLATE=English_United States.utf8
[2] LC_CTYPE=English_United States.utf8
[3] LC_MONETARY=English_United States.utf8
[4] LC_NUMERIC=C
[5] LC_TIME=English_United States.utf8
time zone: America/Chicago
tzcode source: internal
attached base packages:
[1] grid stats4 stats graphics grDevices utils datasets
[8] methods base
other attached packages:
[1] TxDb.Hsapiens.UCSC.hg38.knownGene_3.18.0
[2] RColorBrewer_1.1-3
[3] clusterProfiler_4.10.1
[4] pheatmap_1.0.12
[5] qvalue_2.34.0
[6] BiocParallel_1.36.0
[7] cluster_2.1.8.1
[8] ggfortify_0.4.17
[9] reshape2_1.4.4
[10] circlize_0.4.16
[11] ComplexHeatmap_2.18.0
[12] Homo.sapiens_1.3.1
[13] TxDb.Hsapiens.UCSC.hg19.knownGene_3.2.2
[14] org.Hs.eg.db_3.18.0
[15] GO.db_3.18.0
[16] OrganismDbi_1.44.0
[17] GenomicFeatures_1.54.4
[18] GenomicRanges_1.54.1
[19] GenomeInfoDb_1.38.8
[20] AnnotationDbi_1.64.1
[21] IRanges_2.36.0
[22] S4Vectors_0.40.2
[23] Biobase_2.62.0
[24] BiocGenerics_0.48.1
[25] biomaRt_2.58.2
[26] scales_1.3.0
[27] lubridate_1.9.4
[28] forcats_1.0.0
[29] stringr_1.5.1
[30] dplyr_1.1.4
[31] purrr_1.0.4
[32] readr_2.1.5
[33] tidyr_1.3.1
[34] tibble_3.2.1
[35] ggplot2_3.5.2
[36] tidyverse_2.0.0
[37] data.table_1.17.0
[38] edgeR_4.0.16
[39] limma_3.58.1
loaded via a namespace (and not attached):
[1] splines_4.3.0 later_1.3.2
[3] BiocIO_1.12.0 ggplotify_0.1.2
[5] bitops_1.0-9 filelock_1.0.3
[7] polyclip_1.10-7 graph_1.80.0
[9] XML_3.99-0.18 lifecycle_1.0.4
[11] doParallel_1.0.17 rprojroot_2.0.4
[13] lattice_0.22-7 vroom_1.6.5
[15] MASS_7.3-60 magrittr_2.0.3
[17] sass_0.4.10 rmarkdown_2.29
[19] jquerylib_0.1.4 yaml_2.3.10
[21] httpuv_1.6.15 cowplot_1.1.3
[23] DBI_1.2.3 abind_1.4-8
[25] zlibbioc_1.48.2 ggraph_2.2.1
[27] RCurl_1.98-1.17 yulab.utils_0.2.0
[29] tweenr_2.0.3 rappdirs_0.3.3
[31] git2r_0.36.2 GenomeInfoDbData_1.2.11
[33] enrichplot_1.22.0 ggrepel_0.9.6
[35] tidytree_0.4.6 codetools_0.2-20
[37] DelayedArray_0.28.0 DOSE_3.28.2
[39] xml2_1.3.8 ggforce_0.4.2
[41] tidyselect_1.2.1 shape_1.4.6.1
[43] aplot_0.2.5 farver_2.1.2
[45] viridis_0.6.5 matrixStats_1.5.0
[47] BiocFileCache_2.10.2 GenomicAlignments_1.38.2
[49] jsonlite_2.0.0 GetoptLong_1.0.5
[51] tidygraph_1.3.1 iterators_1.0.14
[53] foreach_1.5.2 tools_4.3.0
[55] progress_1.2.3 treeio_1.26.0
[57] Rcpp_1.0.12 glue_1.7.0
[59] gridExtra_2.3 SparseArray_1.2.4
[61] xfun_0.52 MatrixGenerics_1.14.0
[63] withr_3.0.2 BiocManager_1.30.25
[65] fastmap_1.2.0 digest_0.6.34
[67] gridGraphics_0.5-1 timechange_0.3.0
[69] R6_2.6.1 colorspace_2.1-0
[71] Cairo_1.6-2 RSQLite_2.3.9
[73] generics_0.1.3 rtracklayer_1.62.0
[75] graphlayouts_1.2.2 prettyunits_1.2.0
[77] httr_1.4.7 S4Arrays_1.2.1
[79] scatterpie_0.2.4 whisker_0.4.1
[81] pkgconfig_2.0.3 gtable_0.3.6
[83] blob_1.2.4 workflowr_1.7.1
[85] XVector_0.42.0 shadowtext_0.1.4
[87] htmltools_0.5.8.1 fgsea_1.28.0
[89] RBGL_1.78.0 clue_0.3-66
[91] png_0.1-8 ggfun_0.1.8
[93] knitr_1.50 rstudioapi_0.17.1
[95] tzdb_0.5.0 rjson_0.2.23
[97] nlme_3.1-168 curl_6.2.2
[99] cachem_1.1.0 GlobalOptions_0.1.2
[101] parallel_4.3.0 HDO.db_0.99.1
[103] restfulr_0.0.15 pillar_1.10.2
[105] vctrs_0.6.5 promises_1.3.2
[107] dbplyr_2.5.0 evaluate_1.0.3
[109] magick_2.8.6 cli_3.6.1
[111] locfit_1.5-9.12 compiler_4.3.0
[113] Rsamtools_2.18.0 rlang_1.1.3
[115] crayon_1.5.3 labeling_0.4.3
[117] plyr_1.8.9 fs_1.6.3
[119] stringi_1.8.3 viridisLite_0.4.2
[121] munsell_0.5.1 Biostrings_2.70.3
[123] lazyeval_0.2.2 GOSemSim_2.28.1
[125] Matrix_1.6-1.1 patchwork_1.3.0
[127] hms_1.1.3 bit64_4.6.0-1
[129] KEGGREST_1.42.0 statmod_1.5.0
[131] SummarizedExperiment_1.32.0 igraph_2.1.4
[133] memoise_2.0.1 bslib_0.9.0
[135] ggtree_3.10.1 fastmatch_1.1-6
[137] bit_4.6.0 gson_0.1.0
[139] ape_5.8-1