Corrmotif Time
Last updated: 2025-03-03
Checks: 7 0
Knit directory: CX5461_Project/
This reproducible R Markdown analysis was created with workflowr (version 1.7.1). The Checks tab describes the reproducibility checks that were applied when the results were created. The Past versions tab lists the development history.
Great! Since the R Markdown file has been committed to the Git repository, you know the exact version of the code that produced these results.
Great job! The global environment was empty. Objects defined in the global environment can affect the analysis in your R Markdown file in unknown ways. For reproduciblity it’s best to always run the code in an empty environment.
The command set.seed(20250129) was run prior to running
the code in the R Markdown file. Setting a seed ensures that any results
that rely on randomness, e.g. subsampling or permutations, are
reproducible.
Great job! Recording the operating system, R version, and package versions is critical for reproducibility.
Nice! There were no cached chunks for this analysis, so you can be confident that you successfully produced the results during this run.
Great job! Using relative paths to the files within your workflowr project makes it easier to run your code on other machines.
Great! You are using Git for version control. Tracking code development and connecting the code version to the results is critical for reproducibility.
The results in this page were generated with repository version 605b184. See the Past versions tab to see a history of the changes made to the R Markdown and HTML files.
Note that you need to be careful to ensure that all relevant files for
the analysis have been committed to Git prior to generating the results
(you can use wflow_publish or
wflow_git_commit). workflowr only checks the R Markdown
file, but you know if there are other scripts or data files that it
depends on. Below is the status of the Git repository when the results
were generated:
Ignored files:
    Ignored:    .RData
    Ignored:    .Rhistory
    Ignored:    .Rproj.user/
Note that any generated files, e.g. HTML, png, CSS, etc., are not included in this status report because it is ok for generated content to have uncommitted changes.
These are the previous versions of the repository in which changes were
made to the R Markdown (analysis/Corrmotif_Time.Rmd) and
HTML (docs/Corrmotif_Time.html) files. If you’ve configured
a remote Git repository (see ?wflow_git_remote), click on
the hyperlinks in the table below to view the files as they were in that
past version.
| File | Version | Author | Date | Message |
|---|---|---|---|---|
| html | 605b184 | sayanpaul01 | 2025-03-03 | Commit |
| Rmd | 6121538 | sayanpaul01 | 2025-03-03 | Commit |
| html | 6121538 | sayanpaul01 | 2025-03-03 | Commit |
| Rmd | fb09f5f | sayanpaul01 | 2025-03-03 | Commit |
| html | fb09f5f | sayanpaul01 | 2025-03-03 | Commit |
| Rmd | 867944a | sayanpaul01 | 2025-02-28 | Commit |
| html | 867944a | sayanpaul01 | 2025-02-28 | Commit |
| Rmd | 177fd18 | sayanpaul01 | 2025-02-28 | Commit |
| html | 177fd18 | sayanpaul01 | 2025-02-28 | Commit |
| html | 3fdb15c | sayanpaul01 | 2025-02-26 | Commit |
| Rmd | af50d4b | sayanpaul01 | 2025-02-26 | Commit |
| html | af50d4b | sayanpaul01 | 2025-02-26 | Commit |
| Rmd | b2a1c90 | sayanpaul01 | 2025-02-26 | Commit |
| html | b2a1c90 | sayanpaul01 | 2025-02-26 | Commit |
| Rmd | f84821f | sayanpaul01 | 2025-02-26 | Commit |
| html | f84821f | sayanpaul01 | 2025-02-26 | Commit |
📌 Fit Limma Model Functions
## Fit limma model using code as it is found in the original cormotif code. It has
## only been modified to add names to the matrix of t values, as well as the
## limma fits

limmafit.default <- function(exprs,groupid,compid) {
  limmafits  <- list()
  compnum    <- nrow(compid)
  genenum    <- nrow(exprs)
  limmat     <- matrix(0,genenum,compnum)
  limmas2    <- rep(0,compnum)
  limmadf    <- rep(0,compnum)
  limmav0    <- rep(0,compnum)
  limmag1num <- rep(0,compnum)
  limmag2num <- rep(0,compnum)

  rownames(limmat)  <- rownames(exprs)
  colnames(limmat)  <- rownames(compid)
  names(limmas2)    <- rownames(compid)
  names(limmadf)    <- rownames(compid)
  names(limmav0)    <- rownames(compid)
  names(limmag1num) <- rownames(compid)
  names(limmag2num) <- rownames(compid)

  for(i in 1:compnum) {
    selid1 <- which(groupid == compid[i,1])
    selid2 <- which(groupid == compid[i,2])
    eset   <- new("ExpressionSet", exprs=cbind(exprs[,selid1],exprs[,selid2]))
    g1num  <- length(selid1)
    g2num  <- length(selid2)
    designmat <- cbind(base=rep(1,(g1num+g2num)), delta=c(rep(0,g1num),rep(1,g2num)))
    fit <- lmFit(eset,designmat)
    fit <- eBayes(fit)
    limmat[,i] <- fit$t[,2]
    limmas2[i] <- fit$s2.prior
    limmadf[i] <- fit$df.prior
    limmav0[i] <- fit$var.prior[2]
    limmag1num[i] <- g1num
    limmag2num[i] <- g2num
    limmafits[[i]] <- fit

    # log odds
    # w<-sqrt(1+fit$var.prior[2]/(1/g1num+1/g2num))
    # log(0.99)+dt(fit$t[1,2],g1num+g2num-2+fit$df.prior,log=TRUE)-log(0.01)-dt(fit$t[1,2]/w, g1num+g2num-2+fit$df.prior, log=TRUE)+log(w)
  }
  names(limmafits) <- rownames(compid)
  limmacompnum<-nrow(compid)
  result<-list(t       = limmat,
               v0      = limmav0,
               df0     = limmadf,
               s20     = limmas2,
               g1num   = limmag1num,
               g2num   = limmag2num,
               compnum = limmacompnum,
               fits    = limmafits)
}

limmafit.counts <-
  function (exprs, groupid, compid, norm.factor.method = "TMM", voom.normalize.method = "none")
  {
    limmafits  <- list()
    compnum    <- nrow(compid)
    genenum    <- nrow(exprs)
    limmat     <- matrix(NA,genenum,compnum)
    limmas2    <- rep(0,compnum)
    limmadf    <- rep(0,compnum)
    limmav0    <- rep(0,compnum)
    limmag1num <- rep(0,compnum)
    limmag2num <- rep(0,compnum)

    rownames(limmat)  <- rownames(exprs)
    colnames(limmat)  <- rownames(compid)
    names(limmas2)    <- rownames(compid)
    names(limmadf)    <- rownames(compid)
    names(limmav0)    <- rownames(compid)
    names(limmag1num) <- rownames(compid)
    names(limmag2num) <- rownames(compid)

    for (i in 1:compnum) {
      message(paste("Running limma for comparision",i,"/",compnum))
      selid1 <- which(groupid == compid[i, 1])
      selid2 <- which(groupid == compid[i, 2])
      # make a new count data frame
      counts <- cbind(exprs[, selid1], exprs[, selid2])

      # remove NAs
      not.nas <- which(apply(counts, 1, function(x) !any(is.na(x))) == TRUE)

      # runn voom/limma
      d <- DGEList(counts[not.nas,])
      d <- calcNormFactors(d, method = norm.factor.method)
      g1num <- length(selid1)
      g2num <- length(selid2)
      designmat <- cbind(base = rep(1, (g1num + g2num)), delta = c(rep(0,
                                                                       g1num), rep(1, g2num)))

      y <- voom(d, designmat, normalize.method = voom.normalize.method)
      fit <- lmFit(y, designmat)
      fit <- eBayes(fit)

      limmafits[[i]] <- fit
      limmat[not.nas, i] <- fit$t[, 2]
      limmas2[i] <- fit$s2.prior
      limmadf[i] <- fit$df.prior
      limmav0[i] <- fit$var.prior[2]
      limmag1num[i] <- g1num
      limmag2num[i] <- g2num
    }
    limmacompnum <- nrow(compid)
    names(limmafits) <- rownames(compid)
    result <- list(t       = limmat,
                   v0      = limmav0,
                   df0     = limmadf,
                   s20     = limmas2,
                   g1num   = limmag1num,
                   g2num   = limmag2num,
                   compnum = limmacompnum,
                   fits    = limmafits)
  }

limmafit.list <-
  function (fitlist, cmp.idx=2)
  {
    compnum    <- length(fitlist)

    genes <- c()
    for (i in 1:compnum) genes <- unique(c(genes, rownames(fitlist[[i]])))

    genenum    <- length(genes)
    limmat     <- matrix(NA,genenum,compnum)
    limmas2    <- rep(0,compnum)
    limmadf    <- rep(0,compnum)
    limmav0    <- rep(0,compnum)
    limmag1num <- rep(0,compnum)
    limmag2num <- rep(0,compnum)

    rownames(limmat)  <- genes
    colnames(limmat)  <- names(fitlist)
    names(limmas2)    <- names(fitlist)
    names(limmadf)    <- names(fitlist)
    names(limmav0)    <- names(fitlist)
    names(limmag1num) <- names(fitlist)
    names(limmag2num) <- names(fitlist)

    for (i in 1:compnum) {
      this.t <- fitlist[[i]]$t[,cmp.idx]
      limmat[names(this.t),i] <- this.t

      limmas2[i]    <- fitlist[[i]]$s2.prior
      limmadf[i]    <- fitlist[[i]]$df.prior
      limmav0[i]    <- fitlist[[i]]$var.prior[cmp.idx]
      limmag1num[i] <- sum(fitlist[[i]]$design[,cmp.idx]==0)
      limmag2num[i] <- sum(fitlist[[i]]$design[,cmp.idx]==1)
    }

    limmacompnum <- compnum
    result <- list(t       = limmat,
                   v0      = limmav0,
                   df0     = limmadf,
                   s20     = limmas2,
                   g1num   = limmag1num,
                   g2num   = limmag2num,
                   compnum = limmacompnum,
                   fits    = limmafits)

  }

## Rank genes based on statistics
generank<-function(x) {
  xcol<-ncol(x)
  xrow<-nrow(x)
  result<-matrix(0,xrow,xcol)
  z<-(1:1:xrow)
  for(i in 1:xcol) {
    y<-sort(x[,i],decreasing=TRUE,na.last=TRUE)
    result[,i]<-match(x[,i],y)
    result[,i]<-order(result[,i])
  }
  result
}

## Log-likelihood for moderated t under H0
modt.f0.loglike<-function(x,df) {
  a<-dt(x, df, log=TRUE)
  result<-as.vector(a)
  flag<-which(is.na(result)==TRUE)
  result[flag]<-0
  result
}

## Log-likelihood for moderated t under H1
## param=c(df,g1num,g2num,v0)
modt.f1.loglike<-function(x,param) {
  df<-param[1]
  g1num<-param[2]
  g2num<-param[3]
  v0<-param[4]
  w<-sqrt(1+v0/(1/g1num+1/g2num))
  dt(x/w, df, log=TRUE)-log(w)
  a<-dt(x/w, df, log=TRUE)-log(w)
  result<-as.vector(a)
  flag<-which(is.na(result)==TRUE)
  result[flag]<-0
  result
}

## Correlation Motif Fit
cmfit.X<-function(x, type, K=1, tol=1e-3, max.iter=100) {
  ## initialize
  xrow <- nrow(x)
  xcol <- ncol(x)
  loglike0 <- list()
  loglike1 <- list()
  p <- rep(1, K)/K
  q <- matrix(runif(K * xcol), K, xcol)
  q[1, ] <- rep(0.01, xcol)
  for (i in 1:xcol) {
    f0 <- type[[i]][[1]]
    f0param <- type[[i]][[2]]
    f1 <- type[[i]][[3]]
    f1param <- type[[i]][[4]]
    loglike0[[i]] <- f0(x[, i], f0param)
    loglike1[[i]] <- f1(x[, i], f1param)
  }
  condlike <- list()
  for (i in 1:xcol) {
    condlike[[i]] <- matrix(0, xrow, K)
  }
  loglike.old <- -1e+10
  for (i.iter in 1:max.iter) {
    if ((i.iter%%50) == 0) {
      print(paste("We have run the first ", i.iter, " iterations for K=",
                  K, sep = ""))
    }
    err <- tol + 1
    clustlike <- matrix(0, xrow, K)
    #templike <- matrix(0, xrow, 2)
    templike1 <- rep(0, xrow)
    templike2 <- rep(0, xrow)
    for (j in 1:K) {
      for (i in 1:xcol) {
        templike1 <- log(q[j, i]) + loglike1[[i]]
        templike2 <- log(1 - q[j, i]) + loglike0[[i]]
        tempmax <- Rfast::Pmax(templike1, templike2)

        templike1 <- exp(templike1 - tempmax)
        templike2 <- exp(templike2 - tempmax)

        tempsum <- templike1 + templike2
        clustlike[, j] <- clustlike[, j] + tempmax +
          log(tempsum)
        condlike[[i]][, j] <- templike1/tempsum
      }
      clustlike[, j] <- clustlike[, j] + log(p[j])
    }
    #tempmax <- apply(clustlike, 1, max)
    tempmax <- Rfast::rowMaxs(clustlike, value=TRUE)
    for (j in 1:K) {
      clustlike[, j] <- exp(clustlike[, j] - tempmax)
    }
    #tempsum <- apply(clustlike, 1, sum)
    tempsum <- Rfast::rowsums(clustlike)
    for (j in 1:K) {
      clustlike[, j] <- clustlike[, j]/tempsum
    }
    #p.new <- (apply(clustlike, 2, sum) + 1)/(xrow + K)
    p.new <- (Rfast::colsums(clustlike) + 1)/(xrow + K)
    q.new <- matrix(0, K, xcol)
    for (j in 1:K) {
      clustpsum <- sum(clustlike[, j])
      for (i in 1:xcol) {
        q.new[j, i] <- (sum(clustlike[, j] * condlike[[i]][,
                                                           j]) + 1)/(clustpsum + 2)
      }
    }
    err.p <- max(abs(p.new - p)/p)
    err.q <- max(abs(q.new - q)/q)
    err <- max(err.p, err.q)
    loglike.new <- (sum(tempmax + log(tempsum)) + sum(log(p.new)) +
                      sum(log(q.new) + log(1 - q.new)))/xrow
    p <- p.new
    q <- q.new
    loglike.old <- loglike.new
    if (err < tol) {
      break
    }
  }
  clustlike <- matrix(0, xrow, K)
  for (j in 1:K) {
    for (i in 1:xcol) {
      templike1 <- log(q[j, i]) + loglike1[[i]]
      templike2 <- log(1 - q[j, i]) + loglike0[[i]]
      tempmax <- Rfast::Pmax(templike1, templike2)

      templike1 <- exp(templike1 - tempmax)
      templike2 <- exp(templike2 - tempmax)

      tempsum <- templike1 + templike2
      clustlike[, j] <- clustlike[, j] + tempmax + log(tempsum)
      condlike[[i]][, j] <- templike1/tempsum
    }
    clustlike[, j] <- clustlike[, j] + log(p[j])
  }
  #tempmax <- apply(clustlike, 1, max)
  tempmax <- Rfast::rowMaxs(clustlike, value=TRUE)
  for (j in 1:K) {
    clustlike[, j] <- exp(clustlike[, j] - tempmax)
  }
  #tempsum <- apply(clustlike, 1, sum)
  tempsum <- Rfast::rowsums(clustlike)
  for (j in 1:K) {
    clustlike[, j] <- clustlike[, j]/tempsum
  }
  p.post <- matrix(0, xrow, xcol)
  for (j in 1:K) {
    for (i in 1:xcol) {
      p.post[, i] <- p.post[, i] + clustlike[, j] * condlike[[i]][,
                                                                  j]
    }
  }
  loglike.old <- loglike.old - (sum(log(p)) + sum(log(q) +
                                                    log(1 - q)))/xrow
  loglike.old <- loglike.old * xrow
  result <- list(p.post = p.post, motif.prior = p, motif.q = q,
                 loglike = loglike.old, clustlike=clustlike, condlike=condlike)
}

## Fit using (0,0,...,0) and (1,1,...,1)
cmfitall<-function(x, type, tol=1e-3, max.iter=100) {
  ## initialize
  xrow<-nrow(x)
  xcol<-ncol(x)
  loglike0<-list()
  loglike1<-list()
  p<-0.01

  ## compute loglikelihood
  L0<-matrix(0,xrow,1)
  L1<-matrix(0,xrow,1)
  for(i in 1:xcol) {
    f0<-type[[i]][[1]]
    f0param<-type[[i]][[2]]
    f1<-type[[i]][[3]]
    f1param<-type[[i]][[4]]
    loglike0[[i]]<-f0(x[,i],f0param)
    loglike1[[i]]<-f1(x[,i],f1param)
    L0<-L0+loglike0[[i]]
    L1<-L1+loglike1[[i]]
  }


  ## EM algorithm to get MLE of p and q
  loglike.old <- -1e10
  for(i.iter in 1:max.iter) {
    if((i.iter%%50) == 0) {
      print(paste("We have run the first ", i.iter, " iterations",sep=""))
    }
    err<-tol+1

    ## compute posterior cluster membership
    clustlike<-matrix(0,xrow,2)
    clustlike[,1]<-log(1-p)+L0
    clustlike[,2]<-log(p)+L1

    tempmax<-apply(clustlike,1,max)
    for(j in 1:2) {
      clustlike[,j]<-exp(clustlike[,j]-tempmax)
    }
    tempsum<-apply(clustlike,1,sum)

    ## update motif occurrence rate
    for(j in 1:2) {
      clustlike[,j]<-clustlike[,j]/tempsum
    }

    p.new<-(sum(clustlike[,2])+1)/(xrow+2)

    ## evaluate convergence
    err<-abs(p.new-p)/p

    ## evaluate whether the log.likelihood increases
    loglike.new<-(sum(tempmax+log(tempsum))+log(p.new)+log(1-p.new))/xrow

    loglike.old<-loglike.new
    p<-p.new

    if(err<tol) {
      break;
    }
  }

  ## compute posterior p
  clustlike<-matrix(0,xrow,2)
  clustlike[,1]<-log(1-p)+L0
  clustlike[,2]<-log(p)+L1

  tempmax<-apply(clustlike,1,max)
  for(j in 1:2) {
    clustlike[,j]<-exp(clustlike[,j]-tempmax)
  }
  tempsum<-apply(clustlike,1,sum)

  for(j in 1:2) {
    clustlike[,j]<-clustlike[,j]/tempsum
  }

  p.post<-matrix(0,xrow,xcol)
  for(i in 1:xcol) {
    p.post[,i]<-clustlike[,2]
  }

  ## return

  #calculate back loglikelihood
  loglike.old<-loglike.old-(log(p)+log(1-p))/xrow
  loglike.old<-loglike.old*xrow
  result<-list(p.post=p.post, motif.prior=p, loglike=loglike.old)
}

## Fit each dataset separately
cmfitsep<-function(x, type, tol=1e-3, max.iter=100) {
  ## initialize
  xrow<-nrow(x)
  xcol<-ncol(x)
  loglike0<-list()
  loglike1<-list()
  p<-0.01*rep(1,xcol)
  loglike.final<-rep(0,xcol)

  ## compute loglikelihood
  for(i in 1:xcol) {
    f0<-type[[i]][[1]]
    f0param<-type[[i]][[2]]
    f1<-type[[i]][[3]]
    f1param<-type[[i]][[4]]
    loglike0[[i]]<-f0(x[,i],f0param)
    loglike1[[i]]<-f1(x[,i],f1param)
  }

  p.post<-matrix(0,xrow,xcol)

  ## EM algorithm to get MLE of p
  for(coli in 1:xcol) {
    loglike.old <- -1e10
    for(i.iter in 1:max.iter) {
      if((i.iter%%50) == 0) {
        print(paste("We have run the first ", i.iter, " iterations",sep=""))
      }
      err<-tol+1

      ## compute posterior cluster membership
      clustlike<-matrix(0,xrow,2)
      clustlike[,1]<-log(1-p[coli])+loglike0[[coli]]
      clustlike[,2]<-log(p[coli])+loglike1[[coli]]

      tempmax<-apply(clustlike,1,max)
      for(j in 1:2) {
        clustlike[,j]<-exp(clustlike[,j]-tempmax)
      }
      tempsum<-apply(clustlike,1,sum)

      ## evaluate whether the log.likelihood increases
      loglike.new<-sum(tempmax+log(tempsum))/xrow

      ## update motif occurrence rate
      for(j in 1:2) {
        clustlike[,j]<-clustlike[,j]/tempsum
      }

      p.new<-(sum(clustlike[,2]))/(xrow)

      ## evaluate convergence
      err<-abs(p.new-p[coli])/p[coli]
      loglike.old<-loglike.new
      p[coli]<-p.new

      if(err<tol) {
        break;
      }
    }

    ## compute posterior p
    clustlike<-matrix(0,xrow,2)
    clustlike[,1]<-log(1-p[coli])+loglike0[[coli]]
    clustlike[,2]<-log(p[coli])+loglike1[[coli]]

    tempmax<-apply(clustlike,1,max)
    for(j in 1:2) {
      clustlike[,j]<-exp(clustlike[,j]-tempmax)
    }
    tempsum<-apply(clustlike,1,sum)

    for(j in 1:2) {
      clustlike[,j]<-clustlike[,j]/tempsum
    }

    p.post[,coli]<-clustlike[,2]
    loglike.final[coli]<-loglike.old
  }


  ## return
  loglike.final<-loglike.final*xrow
  result<-list(p.post=p.post, motif.prior=p, loglike=loglike.final)
}

## Fit the full model
cmfitfull<-function(x, type, tol=1e-3, max.iter=100) {
  ## initialize
  xrow<-nrow(x)
  xcol<-ncol(x)
  loglike0<-list()
  loglike1<-list()
  K<-2^xcol
  p<-rep(1,K)/K
  pattern<-rep(0,xcol)
  patid<-matrix(0,K,xcol)

  ## compute loglikelihood
  for(i in 1:xcol) {
    f0<-type[[i]][[1]]
    f0param<-type[[i]][[2]]
    f1<-type[[i]][[3]]
    f1param<-type[[i]][[4]]
    loglike0[[i]]<-f0(x[,i],f0param)
    loglike1[[i]]<-f1(x[,i],f1param)
  }
  L<-matrix(0,xrow,K)
  for(i in 1:K)
  {
    patid[i,]<-pattern
    for(j in 1:xcol) {
      if(pattern[j] < 0.5) {
        L[,i]<-L[,i]+loglike0[[j]]
      } else {
        L[,i]<-L[,i]+loglike1[[j]]
      }
    }

    if(i < K) {
      pattern[xcol]<-pattern[xcol]+1
      j<-xcol
      while(pattern[j] > 1) {
        pattern[j]<-0
        j<-j-1
        pattern[j]<-pattern[j]+1
      }
    }
  }

  ## EM algorithm to get MLE of p and q
  loglike.old <- -1e10
  for(i.iter in 1:max.iter) {
    if((i.iter%%50) == 0) {
      print(paste("We have run the first ", i.iter, " iterations",sep=""))
    }
    err<-tol+1

    ## compute posterior cluster membership
    clustlike<-matrix(0,xrow,K)
    for(j in 1:K) {
      clustlike[,j]<-log(p[j])+L[,j]
    }

    tempmax<-apply(clustlike,1,max)
    for(j in 1:K) {
      clustlike[,j]<-exp(clustlike[,j]-tempmax)
    }
    tempsum<-apply(clustlike,1,sum)

    ## update motif occurrence rate
    for(j in 1:K) {
      clustlike[,j]<-clustlike[,j]/tempsum
    }

    p.new<-(apply(clustlike,2,sum)+1)/(xrow+K)

    ## evaluate convergence
    err<-max(abs(p.new-p)/p)

    ## evaluate whether the log.likelihood increases
    loglike.new<-(sum(tempmax+log(tempsum))+sum(log(p.new)))/xrow

    loglike.old<-loglike.new
    p<-p.new

    if(err<tol) {
      break;
    }
  }

  ## compute posterior p
  clustlike<-matrix(0,xrow,K)
  for(j in 1:K) {
    clustlike[,j]<-log(p[j])+L[,j]
  }

  tempmax<-apply(clustlike,1,max)
  for(j in 1:K) {
    clustlike[,j]<-exp(clustlike[,j]-tempmax)
  }
  tempsum<-apply(clustlike,1,sum)

  for(j in 1:K) {
    clustlike[,j]<-clustlike[,j]/tempsum
  }

  p.post<-matrix(0,xrow,xcol)
  for(j in 1:K) {
    for(i in 1:xcol) {
      if(patid[j,i] > 0.5) {
        p.post[,i]<-p.post[,i]+clustlike[,j]
      }
    }
  }

  ## return
  #calculate back loglikelihood
  loglike.old<-loglike.old-sum(log(p))/xrow
  loglike.old<-loglike.old*xrow
  result<-list(p.post=p.post, motif.prior=p, loglike=loglike.old)
}

generatetype<-function(limfitted)
{
  jtype<-list()
  df<-limfitted$g1num+limfitted$g2num-2+limfitted$df0
  for(j in 1:limfitted$compnum)
  {
    jtype[[j]]<-list(f0=modt.f0.loglike, f0.param=df[j], f1=modt.f1.loglike, f1.param=c(df[j],limfitted$g1num[j],limfitted$g2num[j],limfitted$v0[j]))
  }
  jtype
}

cormotiffit <- function(exprs, groupid=NULL, compid=NULL, K=1, tol=1e-3,
                        max.iter=100, BIC=TRUE, norm.factor.method="TMM",
                        voom.normalize.method = "none", runtype=c("logCPM","counts","limmafits"), each=3)
{
  # first I want to do some typechecking. Input can be either a normalized
  # matrix, a count matrix, or a list of limma fits. Dispatch the correct
  # limmafit accordingly.
  # todo: add some typechecking here
  limfitted <- list()
  if (runtype=="counts") {
    limfitted <- limmafit.counts(exprs,groupid,compid, norm.factor.method, voom.normalize.method)
  } else if (runtype=="logCPM") {
    limfitted <- limmafit.default(exprs,groupid,compid)
  } else if (runtype=="limmafits") {
    limfitted <- limmafit.list(exprs)
  } else {
    stop("runtype must be one of 'logCPM', 'counts', or 'limmafits'")
  }


  jtype<-generatetype(limfitted)
  fitresult<-list()
  ks <- rep(K, each = each)
  fitresult <- bplapply(1:length(ks), function(i, x, type, ks, tol, max.iter) {
    cmfit.X(x, type, K = ks[i], tol = tol, max.iter = max.iter)
  }, x=limfitted$t, type=jtype, ks=ks, tol=tol, max.iter=max.iter)

  best.fitresults <- list()
  for (i in 1:length(K)) {
    w.k <- which(ks==K[i])
    this.bic <- c()
    for (j in w.k) this.bic[j] <- -2 * fitresult[[j]]$loglike + (K[i] - 1 + K[i] * limfitted$compnum) * log(dim(limfitted$t)[1])
    w.min <- which(this.bic == min(this.bic, na.rm = TRUE))[1]
    best.fitresults[[i]] <- fitresult[[w.min]]
  }
  fitresult <- best.fitresults

  bic <- rep(0, length(K))
  aic <- rep(0, length(K))
  loglike <- rep(0, length(K))
  for (i in 1:length(K)) loglike[i] <- fitresult[[i]]$loglike
  for (i in 1:length(K)) bic[i] <- -2 * fitresult[[i]]$loglike + (K[i] - 1 + K[i] * limfitted$compnum) * log(dim(limfitted$t)[1])
  for (i in 1:length(K)) aic[i] <- -2 * fitresult[[i]]$loglike + 2 * (K[i] - 1 + K[i] * limfitted$compnum)
  if(BIC==TRUE) {
    bestflag=which(bic==min(bic))
  }
  else {
    bestflag=which(aic==min(aic))
  }
  result<-list(bestmotif=fitresult[[bestflag]],bic=cbind(K,bic),
               aic=cbind(K,aic),loglike=cbind(K,loglike), allmotifs=fitresult)

}

cormotiffitall<-function(exprs,groupid,compid, tol=1e-3, max.iter=100)
{
  limfitted<-limmafit(exprs,groupid,compid)
  jtype<-generatetype(limfitted)
  fitresult<-cmfitall(limfitted$t,type=jtype,tol=1e-3,max.iter=max.iter)
}

cormotiffitsep<-function(exprs,groupid,compid, tol=1e-3, max.iter=100)
{
  limfitted<-limmafit(exprs,groupid,compid)
  jtype<-generatetype(limfitted)
  fitresult<-cmfitsep(limfitted$t,type=jtype,tol=1e-3,max.iter=max.iter)
}

cormotiffitfull<-function(exprs,groupid,compid, tol=1e-3, max.iter=100)
{
  limfitted<-limmafit(exprs,groupid,compid)
  jtype<-generatetype(limfitted)
  fitresult<-cmfitfull(limfitted$t,type=jtype,tol=1e-3,max.iter=max.iter)
}

plotIC<-function(fitted_cormotif)
{
  oldpar<-par(mfrow=c(1,2))
  plot(fitted_cormotif$bic[,1], fitted_cormotif$bic[,2], type="b",xlab="Motif Number", ylab="BIC", main="BIC")
  plot(fitted_cormotif$aic[,1], fitted_cormotif$aic[,2], type="b",xlab="Motif Number", ylab="AIC", main="AIC")
}

plotMotif<-function(fitted_cormotif,title="")
{
  layout(matrix(1:2,ncol=2))
  u<-1:dim(fitted_cormotif$bestmotif$motif.q)[2]
  v<-1:dim(fitted_cormotif$bestmotif$motif.q)[1]
  image(u,v,t(fitted_cormotif$bestmotif$motif.q),
        col=gray(seq(from=1,to=0,by=-0.1)),xlab="Study",yaxt = "n",
        ylab="Corr. Motifs",main=paste(title,"pattern",sep=" "))
  axis(2,at=1:length(v))
  for(i in 1:(length(u)+1))
  {
    abline(v=(i-0.5))
  }
  for(i in 1:(length(v)+1))
  {
    abline(h=(i-0.5))
  }
  Ng=10000
  if(is.null(fitted_cormotif$bestmotif$p.post)!=TRUE)
    Ng=nrow(fitted_cormotif$bestmotif$p.post)
  genecount=floor(fitted_cormotif$bestmotif$motif.p*Ng)
  NK=nrow(fitted_cormotif$bestmotif$motif.q)
  plot(0,0.7,pch=".",xlim=c(0,1.2),ylim=c(0.75,NK+0.25),
       frame.plot=FALSE,axes=FALSE,xlab="No. of genes",ylab="", main=paste(title,"frequency",sep=" "))
  segments(0,0.7,fitted_cormotif$bestmotif$motif.p[1],0.7)
  rect(0,1:NK-0.3,fitted_cormotif$bestmotif$motif.p,1:NK+0.3,
       col="dark grey")
  mtext(1:NK,at=1:NK,side=2,cex=0.8)
  text(fitted_cormotif$bestmotif$motif.p+0.15,1:NK,
       labels=floor(fitted_cormotif$bestmotif$motif.p*Ng))
}
📌 Load Required Libraries
library(Cormotif)
library(Rfast)
library(dplyr)
library(BiocParallel)
library(gprofiler2)
library(ggplot2)
📌 Corrmotif Model CX 0.1 (3hr, 24hr and 48hr)
Load Corrmotif Data
# Read the Corrmotif Results
Corrmotif <- read.csv("data/Corrmotif/CX5461.csv")
Corrmotif_df <- data.frame(Corrmotif)
rownames(Corrmotif_df) <- Corrmotif_df$Gene

# Filter for CX-5461 (0.1 µM) and Vehicle (0.1 µM) across 3h, 24h, and 48h
exprs.corrmotif <- as.matrix(Corrmotif_df %>%                      dplyr::select(matches("CX_0.1_3|CX_0.1_24|CX_0.1_48|VEH_0.1_3|VEH_0.1_24|VEH_0.1_48")))


# Read group and comparison IDs
groupid <- read.csv("data/Corrmotif/groupid.csv")
groupid_df <- groupid %>%
  dplyr::select(matches("CX_0.1_3|CX_0.1_24|CX_0.1_48|VEH_0.1_3|VEH_0.1_24|VEH_0.1_48"))

compid <- read.csv("data/Corrmotif/Compid.csv")
compid_df <- compid %>%
  filter(Cond1 %in% unique(as.numeric(unlist(groupid_df))) &
           Cond2 %in% unique(as.numeric(unlist(groupid_df))))
📌 Corrmotif Model CX 0.1 (3hr, 24hr and 48hr) (K=1:8)
set.seed(11111)
motif.fitted_CX_0.1 <- cormotiffit(exprs=exprs.corrmotif,
                            groupid=groupid_df, compid=compid_df,
                            K=1:8, max.iter=1000, BIC=TRUE, runtype="logCPM")

gene_prob_CX_0.1 <- motif.fitted_CX_0.1$bestmotif$p.post
rownames(gene_prob_CX_0.1) <- rownames(Corrmotif_df)
motif_prob_CX_0.1 <- motif.fitted_CX_0.1$bestmotif$clustlike
rownames(motif_prob_CX_0.1) <- rownames(gene_prob_CX_0.1)
write.csv(motif_prob_CX_0.1,"data/motif_prob_CX_0.1.csv")
📌 Plot motif CX 0.1 (3hr, 24hr and 48hr)
cormotif_CX_0.1 <- readRDS("data/Corrmotif/cormotif_CX_0.1.RDS")

cormotif_CX_0.1$bic
K bic
[1,] 1 119522.2
[2,] 2 117415.3
[3,] 3 117455.6
[4,] 4 117495.8
[5,] 5 117536.1
[6,] 6 117576.4
[7,] 7 117620.6
[8,] 8 117660.9plotIC(cormotif_CX_0.1)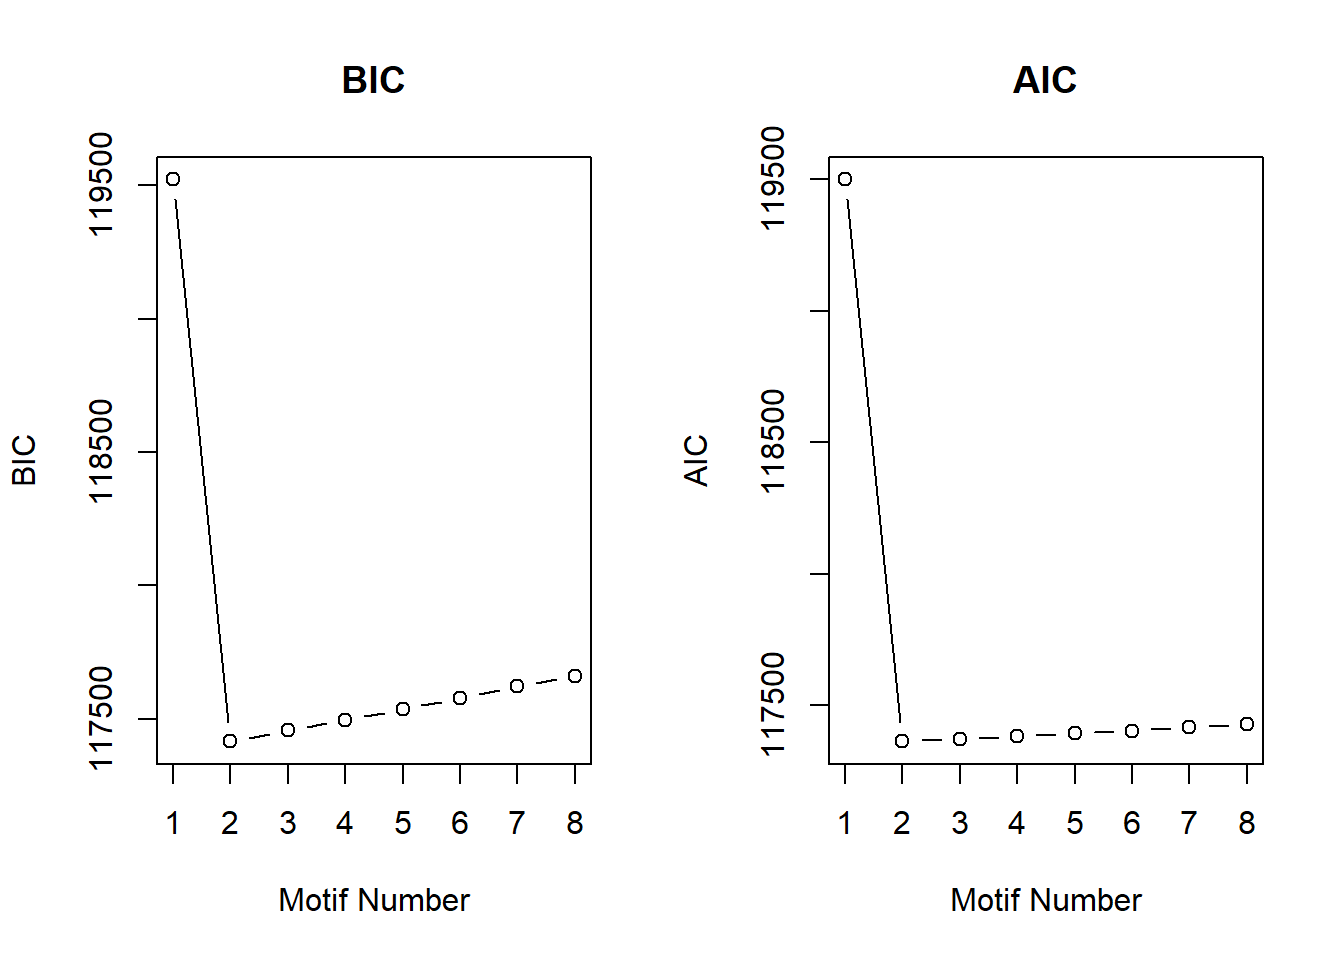
| Version | Author | Date |
|---|---|---|
| 177fd18 | sayanpaul01 | 2025-02-28 |
plotMotif(cormotif_CX_0.1)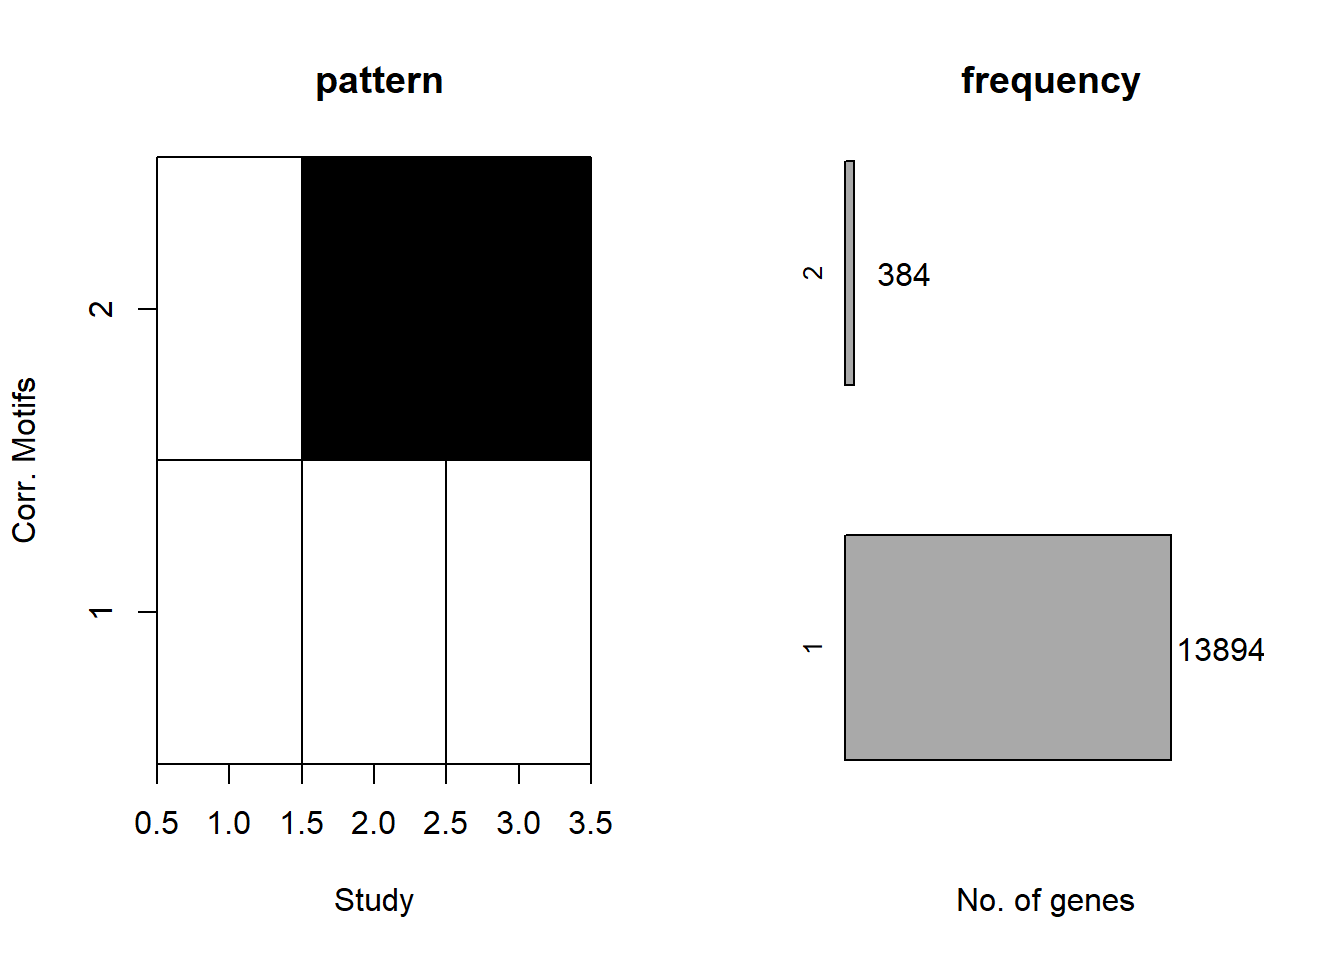
| Version | Author | Date |
|---|---|---|
| 177fd18 | sayanpaul01 | 2025-02-28 |
📌 Distribution of Gene Clusters Identified by Corrmotif (CX 0.1 (3hr, 24hr and 48hr))
# Load necessary libraries
library(ggplot2)

# Data
data <- data.frame(
  Category = c("CX_low_non response", "CX_low_mid_late_response"),
  Value = c(13938, 341)
)

# Add values to category names (to be displayed in the legend)
data$Category <- paste0(data$Category, " (", data$Value, ")")

# Define custom colors with updated category names
custom_colors <- setNames(
  c("#66B2FF", "#99FF99"),
  data$Category  # Ensures color names match updated categories
)

# Create pie chart without number labels inside
ggplot(data, aes(x = "", y = Value, fill = Category)) +
  geom_bar(width = 1, stat = "identity") +
  coord_polar("y", start = 0) +
  labs(title = "Pie Chart (CX 0.1 micromolar)", x = NULL, y = NULL) +
  theme_void() +
  scale_fill_manual(values = custom_colors)  # Corrected color mapping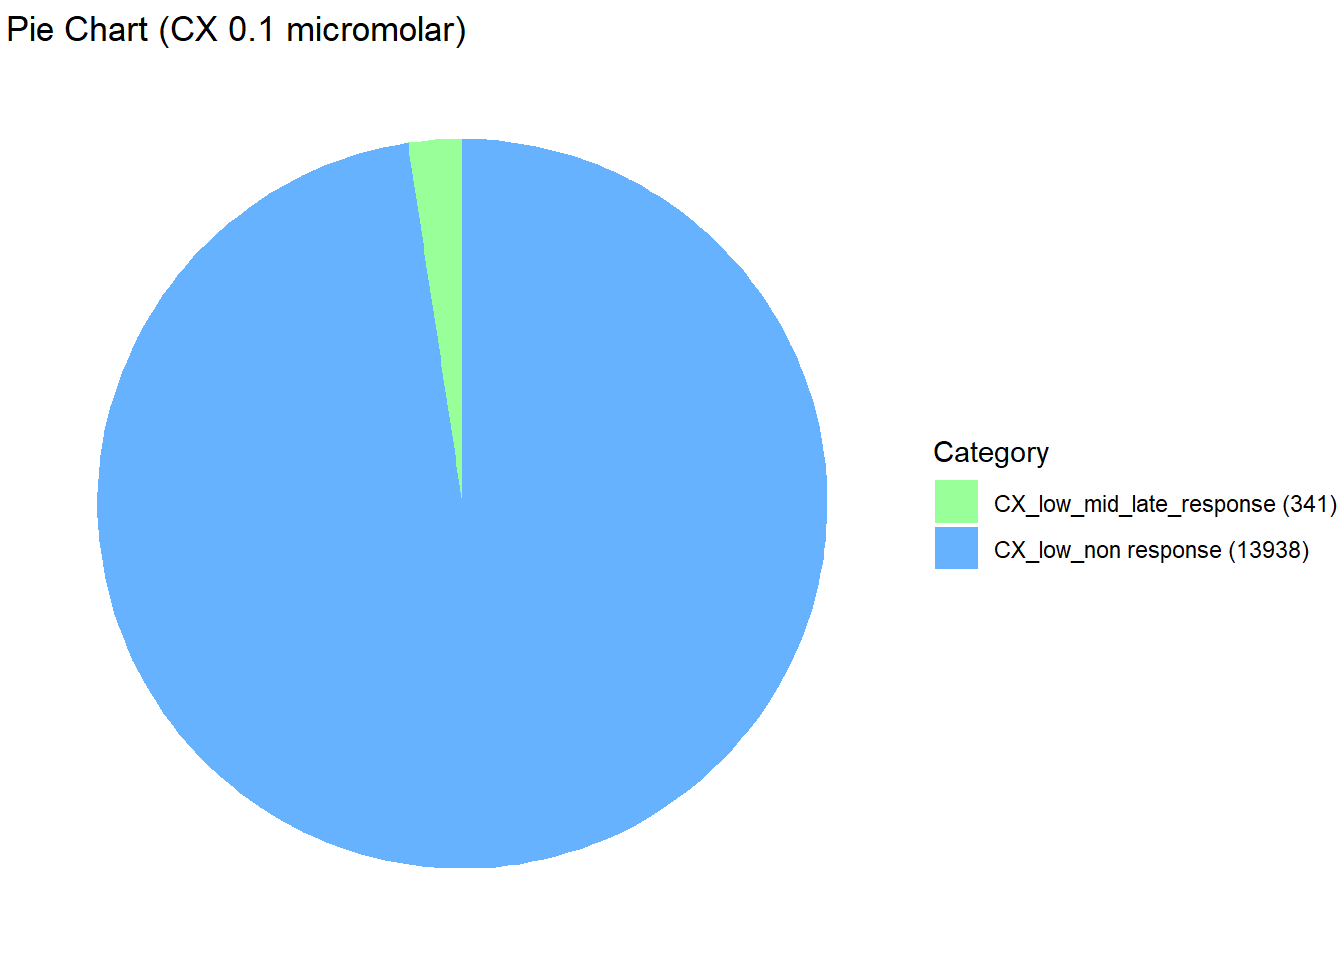
| Version | Author | Date |
|---|---|---|
| 867944a | sayanpaul01 | 2025-02-28 |
Extract Gene Probabilities (CX 0.1 (3hr, 24hr and 48hr))
# Extract posterior probabilities for genes
gene_prob_CX_0.1 <- cormotif_CX_0.1$bestmotif$p.post

rownames(gene_prob_CX_0.1) <- rownames(Corrmotif_df)


prob_CX_1_0.1  <- rownames(gene_prob_CX_0.1[(gene_prob_CX_0.1[,1] <0.5 & gene_prob_CX_0.1[,2] <0.5 & gene_prob_CX_0.1[,3]<0.5),])
length(prob_CX_1_0.1)
[1] 13938prob_CX_2_0.1 <- rownames(gene_prob_CX_0.1[(gene_prob_CX_0.1[,1] <0.5 & gene_prob_CX_0.1[,2] >0.5 & gene_prob_CX_0.1[,3]>0.5),])
length(prob_CX_2_0.1)[1] 341📌 Corrmotif Model CX 0.5 (3hr, 24hr and 48hr)
Load Corrmotif Data
# Read the Corrmotif Results
Corrmotif <- read.csv("data/Corrmotif/CX5461.csv")
Corrmotif_df <- data.frame(Corrmotif)
rownames(Corrmotif_df) <- Corrmotif_df$Gene

# Filter for CX-5461 (0.5 µM) and Vehicle (0.5 µM) across 3h, 24h, and 48h
exprs.corrmotif <- as.matrix(Corrmotif_df[, grep("CX_0.5_3|CX_0.5_24|CX_0.5_48|VEH_0.5_3|VEH_0.5_24|VEH_0.5_48", colnames(Corrmotif_df))])


# Read group and comparison IDs
groupid <- read.csv("data/Corrmotif/groupid.csv")
groupid_df <- groupid %>%
  dplyr::select(matches("CX_0.5_3|CX_0.5_24|CX_0.5_48|VEH_0.5_3|VEH_0.5_24|VEH_0.5_48", colnames(groupid)))


compid <- read.csv("data/Corrmotif/Compid.csv")
compid_df <- compid[compid$Cond1 %in% unique(as.numeric(groupid_df)) & compid$Cond2 %in% unique(as.numeric(groupid_df)), ]
📌 Corrmotif Model CX 0.5 (3hr, 24hr and 48hr) (K=1:8)
set.seed(11111)
motif.fitted_CX_0.5 <- cormotiffit(exprs=exprs.corrmotif,
                            groupid=groupid_df, compid=compid_df,
                            K=1:8, max.iter=1000, BIC=TRUE, runtype="logCPM")

gene_prob_CX_0.5 <- motif.fitted_CX_0.5$bestmotif$p.post
rownames(gene_prob_CX_0.5) <- rownames(Corrmotif_df)
motif_prob_CX_0.5 <- motif.fitted_CX_0.5$bestmotif$clustlike
rownames(motif_prob_CX_0.5) <- rownames(gene_prob_CX_0.5)
write.csv(motif_prob_CX_0.5,"data/motif_prob_CX_0.5.csv")
📌 Plot motif CX 0.5 (3hr, 24hr and 48hr)
cormotif_CX_0.5 <- readRDS("data/Corrmotif/cormotif_CX_0.5.RDS")

cormotif_CX_0.5$bic
K bic
[1,] 1 124024.3
[2,] 2 121807.6
[3,] 3 121847.9
[4,] 4 121888.1
[5,] 5 121928.4
[6,] 6 121968.6
[7,] 7 122012.9
[8,] 8 122053.1plotIC(cormotif_CX_0.5)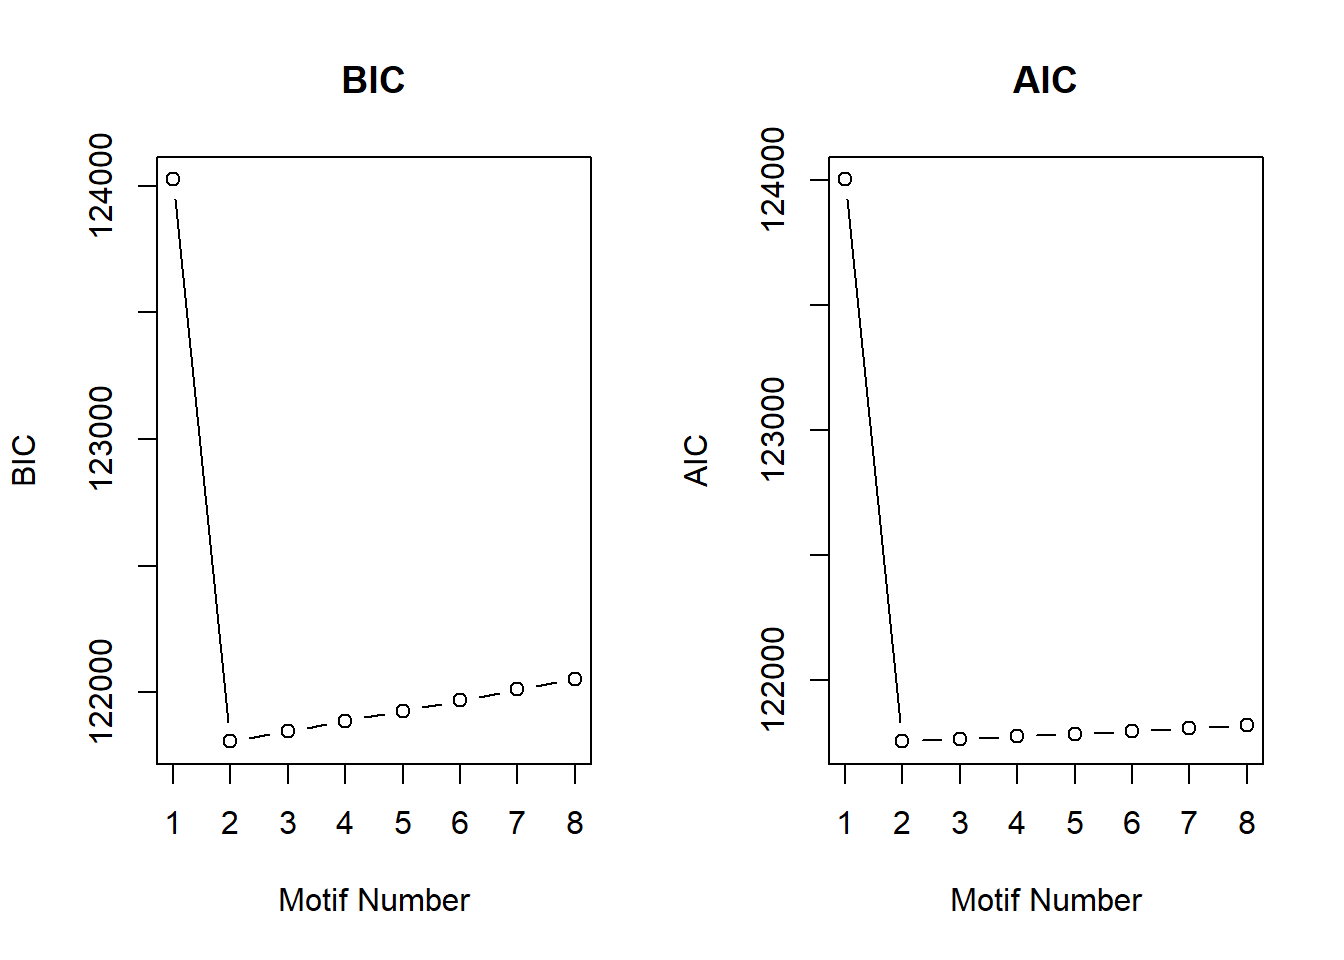
| Version | Author | Date |
|---|---|---|
| 177fd18 | sayanpaul01 | 2025-02-28 |
plotMotif(cormotif_CX_0.5)
| Version | Author | Date |
|---|---|---|
| 177fd18 | sayanpaul01 | 2025-02-28 |
📌 Distribution of Gene Clusters Identified by Corrmotif (CX 0.5 (3hr, 24hr and 48hr))
# Load necessary libraries
library(ggplot2)

# Data
data <- data.frame(
  Category = c("CX_high_non response", "CX_high_mid_late_response"),
  Value = c(13892, 385)
)

# Add values to category names (to be displayed in the legend)
data$Category <- paste0(data$Category, " (", data$Value, ")")

# Define custom colors with updated category names
custom_colors <- setNames(
  c("#66B2FF", "#99FF99"),
  data$Category  # Ensures color names match updated categories
)

# Create pie chart without number labels inside
ggplot(data, aes(x = "", y = Value, fill = Category)) +
  geom_bar(width = 1, stat = "identity") +
  coord_polar("y", start = 0) +
  labs(title = "Pie Chart (CX 0.5 micromolar)", x = NULL, y = NULL) +
  theme_void() +
  scale_fill_manual(values = custom_colors)  # Corrected color mapping
| Version | Author | Date |
|---|---|---|
| 867944a | sayanpaul01 | 2025-02-28 |
Extract Gene Probabilities (CX 0.5 (3hr, 24hr and 48hr))
# Extract posterior probabilities for genes
gene_prob_CX_0.5 <- cormotif_CX_0.5$bestmotif$p.post

rownames(gene_prob_CX_0.5) <- rownames(Corrmotif_df)


prob_CX_1_0.5  <- rownames(gene_prob_CX_0.5[(gene_prob_CX_0.5[,1] <0.5 & gene_prob_CX_0.5[,2] <0.5 & gene_prob_CX_0.5[,3]<0.5),])
length(prob_CX_1_0.5)
[1] 13892prob_CX_2_0.5 <- rownames(gene_prob_CX_0.5[(gene_prob_CX_0.5[,1] <0.5 & gene_prob_CX_0.5[,2] >0.5 & gene_prob_CX_0.5[,3]>0.5),])
length(prob_CX_2_0.5)[1] 385📌 Corrmotif Model DOX 0.1 (3hr, 24hr and 48hr)
Load Corrmotif Data
# Read the Corrmotif Results
Corrmotif <- read.csv("data/Corrmotif/CX5461.csv")
Corrmotif_df <- data.frame(Corrmotif)
rownames(Corrmotif_df) <- Corrmotif_df$Gene

# Filter for DOX (0.1 µM) and Vehicle (0.1 µM) across 3h, 24h, and 48h
exprs.corrmotif <- as.matrix(Corrmotif_df[, grep("DOX_0.1_3|DOX_0.1_24|DOX_0.1_48|VEH_0.1_3|VEH_0.1_24|VEH_0.1_48", colnames(Corrmotif_df))])

# Read group and comparison IDs
groupid <- read.csv("data/Corrmotif/groupid.csv")
groupid_df <- groupid %>%
  dplyr::select(matches("DOX_0.1_3|DOX_0.1_24|DOX_0.1_48|VEH_0.1_3|VEH_0.1_24|VEH_0.1_48", colnames(groupid)))

compid <- read.csv("data/Corrmotif/Compid.csv")
compid_df <- compid[compid$Cond1 %in% unique(as.numeric(groupid_df)) & compid$Cond2 %in% unique(as.numeric(groupid_df)), ]
📌 Corrmotif Model DOX 0.1 (3hr, 24hr and 48hr) (K=1:8)
set.seed(11111)
motif.fitted_DOX_0.1 <- cormotiffit(exprs=exprs.corrmotif,
                            groupid=groupid_df, compid=compid_df,
                            K=1:8, max.iter=1000, BIC=TRUE, runtype="logCPM")

gene_prob_DOX_0.1 <- motif.fitted_DOX_0.1$bestmotif$p.post
rownames(gene_prob_DOX_0.1) <- rownames(Corrmotif_df)
motif_prob_DOX_0.1 <- motif.fitted_DOX_0.1$bestmotif$clustlike
rownames(motif_prob_DOX_0.1) <- rownames(gene_prob_DOX_0.1)
write.csv(motif_prob_DOX_0.1,"data/motif_prob_DOX_0.1.csv")
📌 Plot motif DOX 0.1 (3hr, 24hr and 48hr)
cormotif_DOX_0.1 <- readRDS("data/Corrmotif/cormotif_DOX_0.1.RDS")

cormotif_DOX_0.1$bic
K bic
[1,] 1 172174.3
[2,] 2 167341.3
[3,] 3 167385.4
[4,] 4 167421.8
[5,] 5 167462.0
[6,] 6 167502.3
[7,] 7 167542.5
[8,] 8 167582.8plotIC(cormotif_DOX_0.1)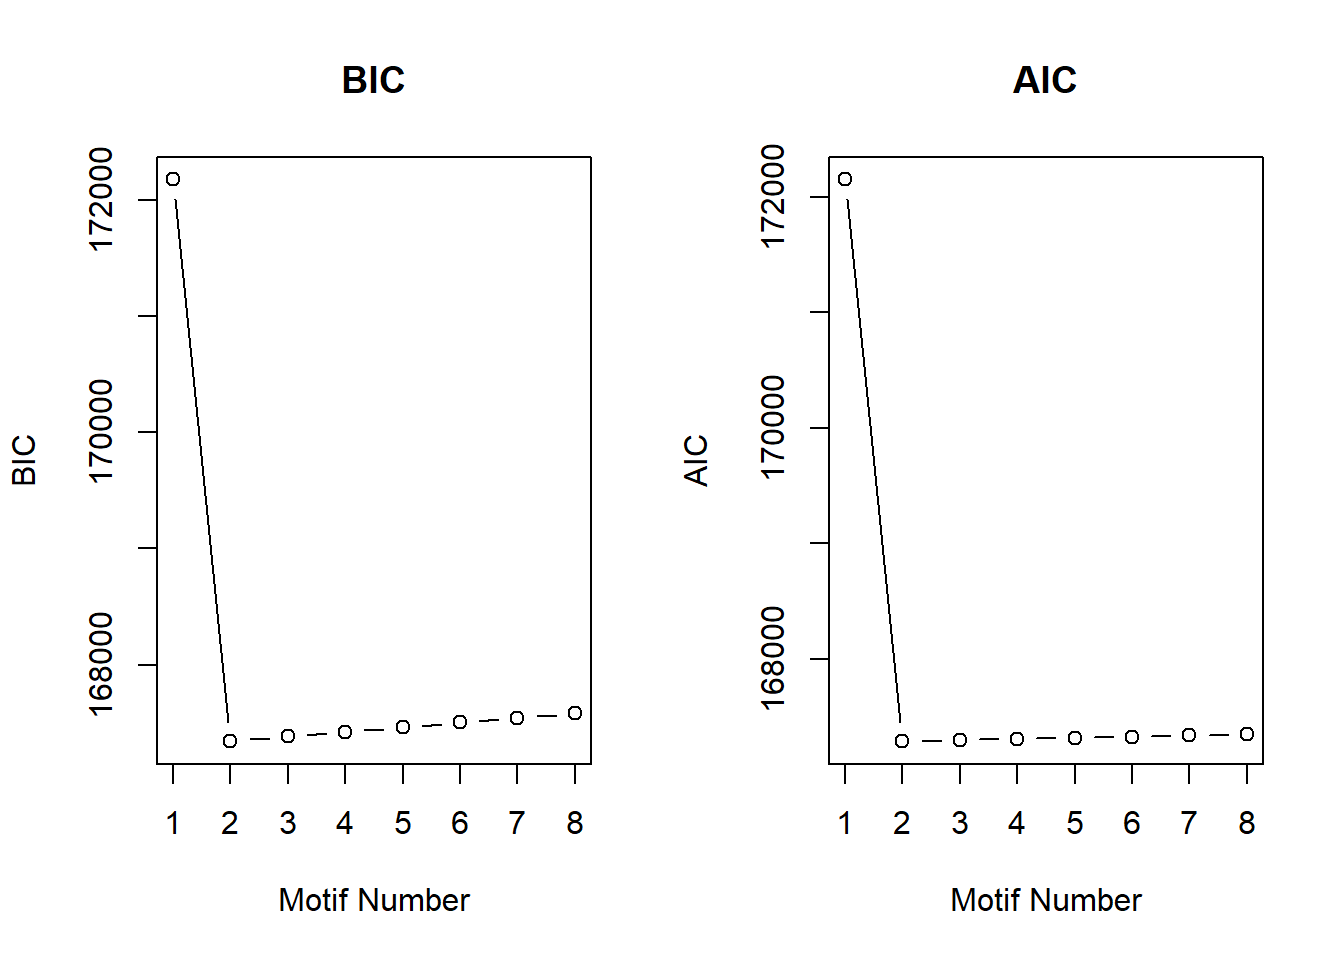
| Version | Author | Date |
|---|---|---|
| 177fd18 | sayanpaul01 | 2025-02-28 |
plotMotif(cormotif_DOX_0.1)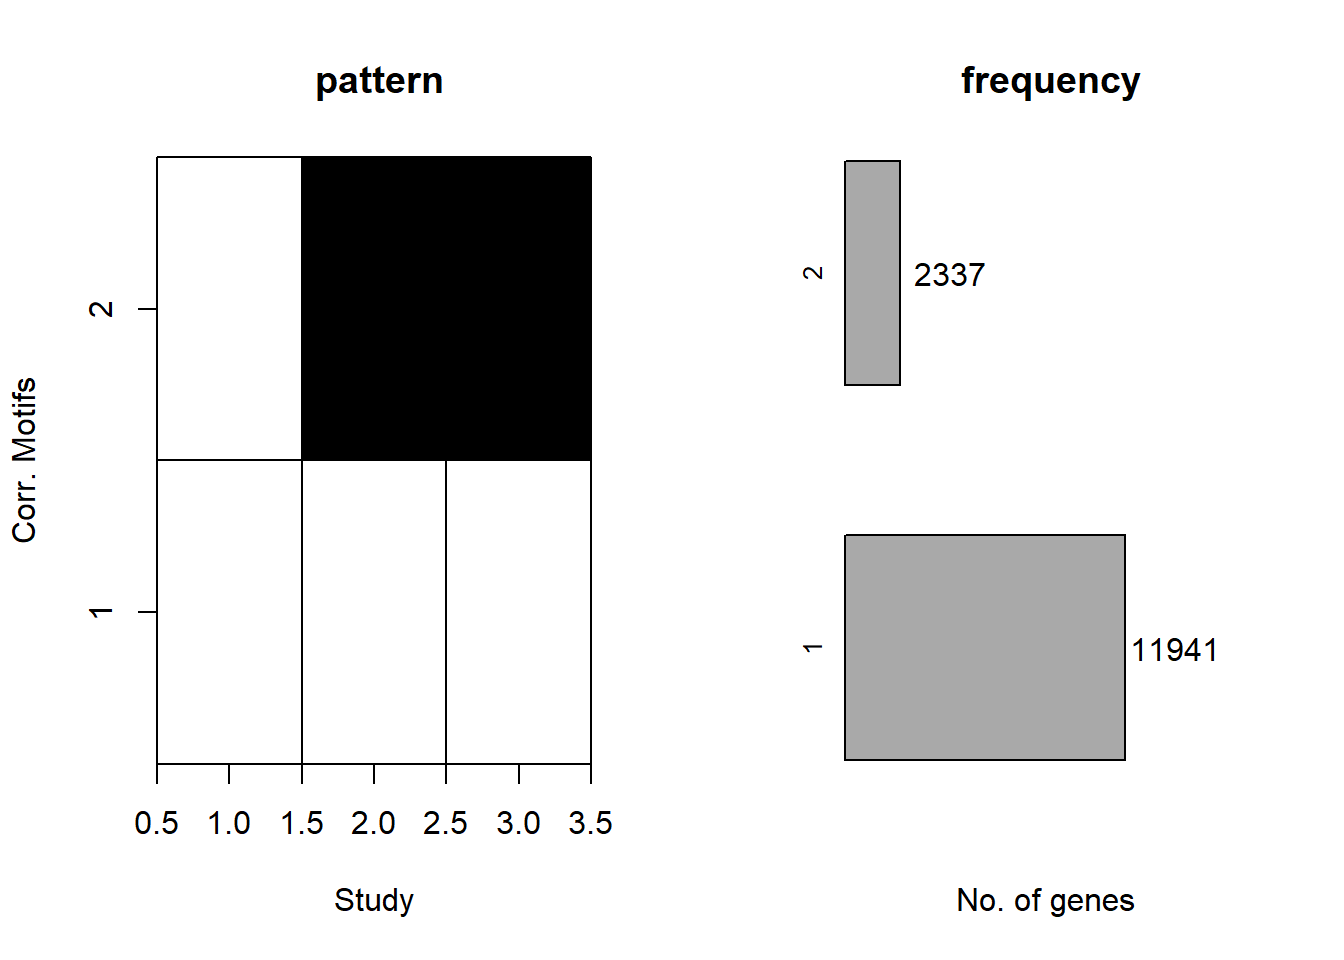
| Version | Author | Date |
|---|---|---|
| 177fd18 | sayanpaul01 | 2025-02-28 |
📌 Distribution of Gene Clusters Identified by Corrmotif (DOX 0.1 (3hr, 24hr and 48hr))
# Load necessary libraries
library(ggplot2)

# Data
data <- data.frame(
  Category = c("DOX_low_non response", "DOX_low_mid_late_response"),
  Value = c(12179, 2099)
)

# Add values to category names (to be displayed in the legend)
data$Category <- paste0(data$Category, " (", data$Value, ")")

# Define custom colors with updated category names
custom_colors <- setNames(
  c("#66B2FF", "#99FF99"),
  data$Category  # Ensures color names match updated categories
)

# Create pie chart without number labels inside
ggplot(data, aes(x = "", y = Value, fill = Category)) +
  geom_bar(width = 1, stat = "identity") +
  coord_polar("y", start = 0) +
  labs(title = "Pie Chart (DOX 0.1 micromolar)", x = NULL, y = NULL) +
  theme_void() +
  scale_fill_manual(values = custom_colors)  # Corrected color mapping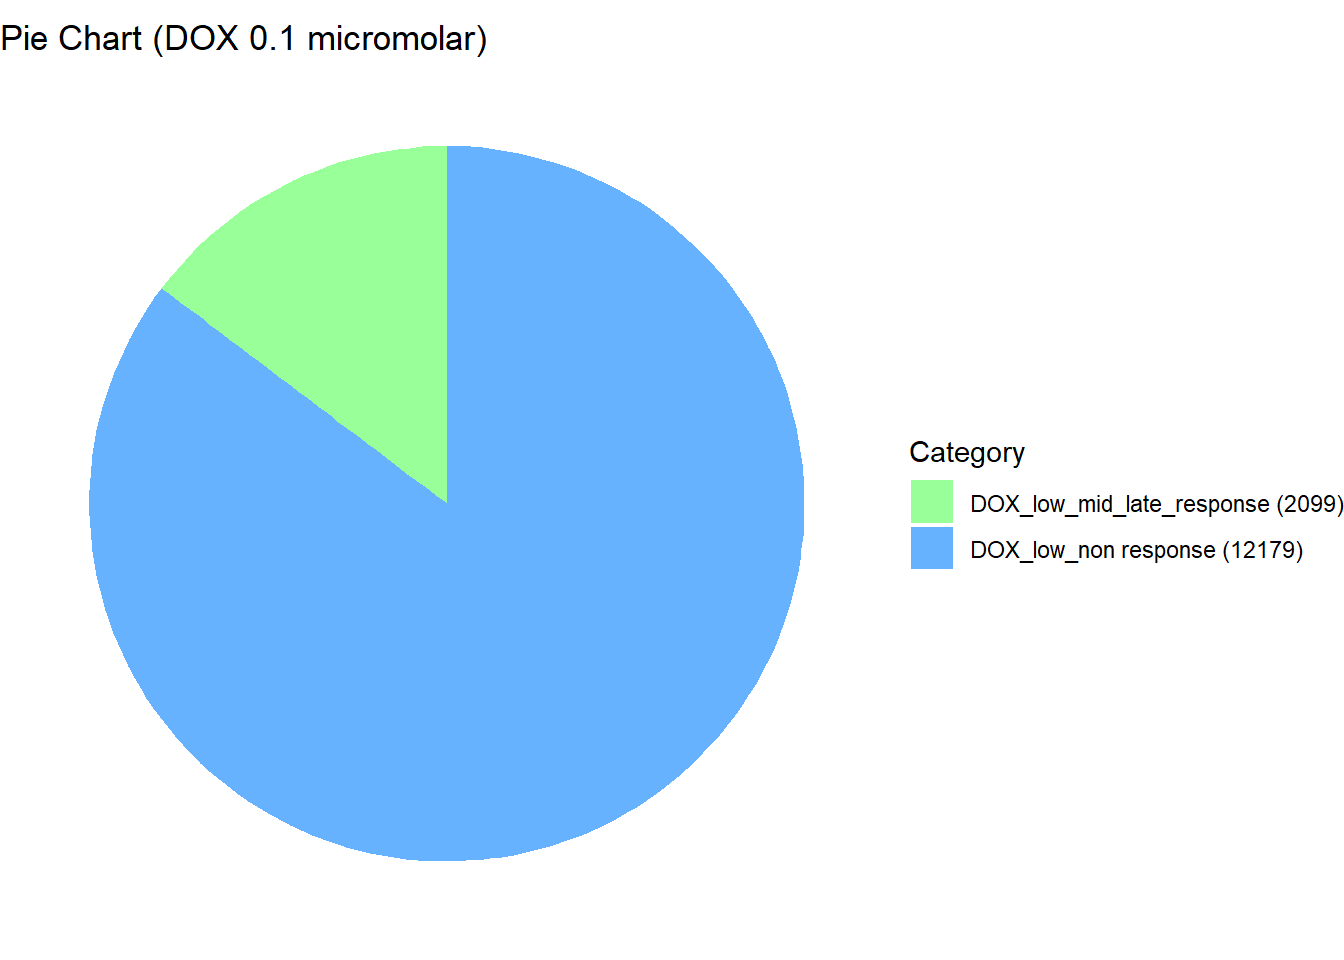
| Version | Author | Date |
|---|---|---|
| 867944a | sayanpaul01 | 2025-02-28 |
Extract Gene Probabilities (DOX 0.1 (3hr, 24hr and 48hr))
# Extract posterior probabilities for genes
gene_prob_DOX_0.1 <- cormotif_DOX_0.1$bestmotif$p.post

rownames(gene_prob_DOX_0.1) <- rownames(Corrmotif_df)


prob_DOX_1_0.1  <- rownames(gene_prob_DOX_0.1[(gene_prob_DOX_0.1[,1] <0.5 & gene_prob_DOX_0.1[,2] <0.5 & gene_prob_DOX_0.1[,3]<0.5),])
length(prob_DOX_1_0.1)
[1] 12179prob_DOX_2_0.1 <- rownames(gene_prob_DOX_0.1[(gene_prob_DOX_0.1[,1] <0.5 & gene_prob_DOX_0.1[,2] >0.5 & gene_prob_DOX_0.1[,3]>0.5),])
length(prob_DOX_2_0.1)[1] 2099📌 Corrmotif Model DOX 0.5 (3hr, 24hr and 48hr)
Load Corrmotif Data
# Read the Corrmotif Results
Corrmotif <- read.csv("data/Corrmotif/CX5461.csv")
Corrmotif_df <- data.frame(Corrmotif)
rownames(Corrmotif_df) <- Corrmotif_df$Gene

# Filter for DOX (0.5 µM) and Vehicle (0.5 µM) across 3h, 24h, and 48h
exprs.corrmotif <- as.matrix(Corrmotif_df[, grep("DOX_0.5_3|DOX_0.5_24|DOX_0.5_48|VEH_0.5_3|VEH_0.5_24|VEH_0.5_48", colnames(Corrmotif_df))])


# Read group and comparison IDs
groupid <- read.csv("data/Corrmotif/groupid.csv")
groupid_df <- groupid %>%
  dplyr::select(matches("DOX_0.5_3|DOX_0.5_24|DOX_0.5_48|VEH_0.5_3|VEH_0.5_24|VEH_0.5_48", colnames(groupid)))


compid <- read.csv("data/Corrmotif/Compid.csv")
compid_df <- compid[compid$Cond1 %in% unique(as.numeric(groupid_df)) & compid$Cond2 %in% unique(as.numeric(groupid_df)), ]
📌 Corrmotif Model DOX 0.5 (3hr, 24hr and 48hr) (K=1:8)
set.seed(11111)
motif.fitted_DOX_0.5 <- cormotiffit(exprs=exprs.corrmotif,
                            groupid=groupid_df, compid=compid_df,
                            K=1:8, max.iter=1000, BIC=TRUE, runtype="logCPM")

gene_prob_DOX_0.5 <- motif.fitted_DOX_0.5$bestmotif$p.post
rownames(gene_prob_DOX_0.5) <- rownames(Corrmotif_df)
motif_prob_DOX_0.5 <- motif.fitted_DOX_0.5$bestmotif$clustlike
rownames(motif_prob_DOX_0.5) <- rownames(gene_prob_DOX_0.5)
write.csv(motif_prob_DOX_0.5,"data/motif_prob_DOX_0.5.csv")
📌 Plot motif DOX 0.1 (3hr, 24hr and 48hr)
cormotif_DOX_0.5 <- readRDS("data/Corrmotif/cormotif_DOX_0.5.RDS")

cormotif_DOX_0.5$bic
K bic
[1,] 1 228116.5
[2,] 2 222769.9
[3,] 3 222778.8
[4,] 4 222820.9
[5,] 5 222861.0
[6,] 6 222901.2
[7,] 7 222943.0
[8,] 8 222981.5plotIC(cormotif_DOX_0.5)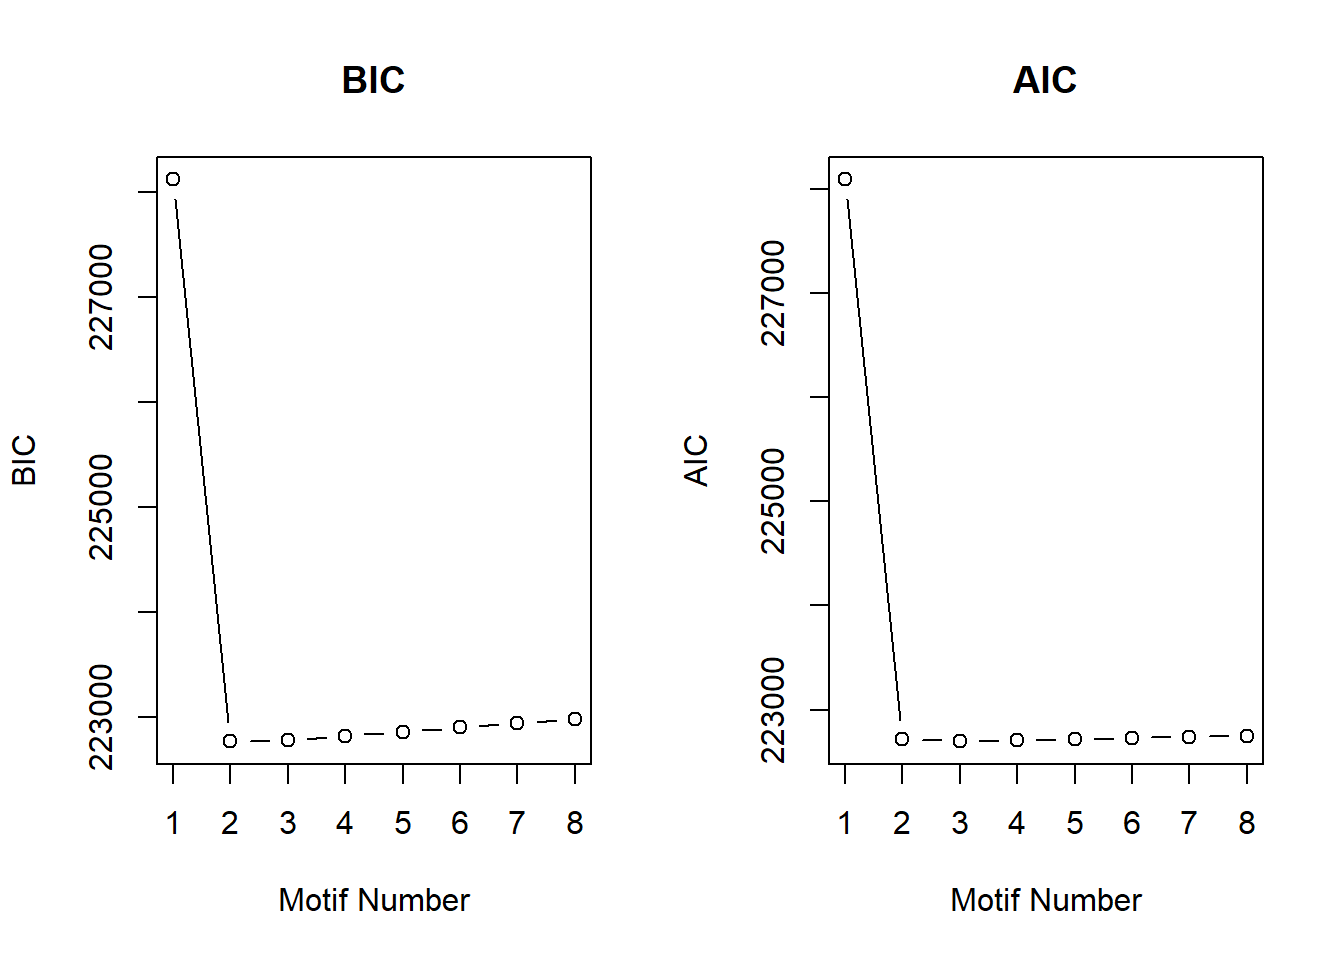
| Version | Author | Date |
|---|---|---|
| 177fd18 | sayanpaul01 | 2025-02-28 |
plotMotif(cormotif_DOX_0.5)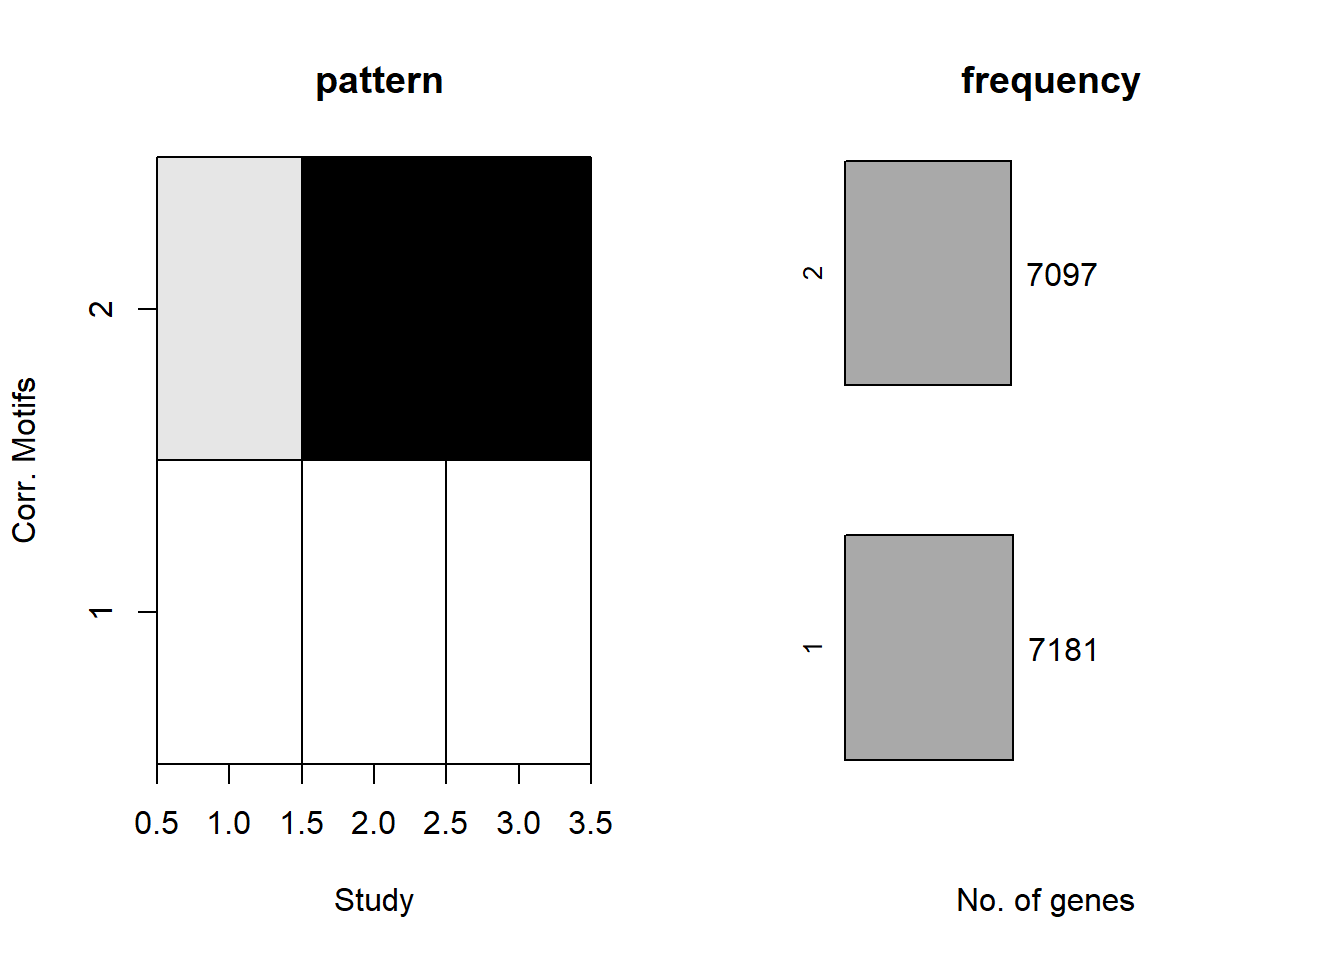
| Version | Author | Date |
|---|---|---|
| 177fd18 | sayanpaul01 | 2025-02-28 |
📌 Distribution of Gene Clusters Identified by Corrmotif (DOX 0.5 (3hr, 24hr and 48hr))
# Load necessary libraries
library(ggplot2)

# Data
data <- data.frame(
  Category = c("DOX_high_non response", "DOX_high_mid_late_response"),
  Value = c(7320, 6890)
)

# Add values to category names (to be displayed in the legend)
data$Category <- paste0(data$Category, " (", data$Value, ")")

# Define custom colors with updated category names
custom_colors <- setNames(
  c("#66B2FF", "#99FF99"),
  data$Category  # Ensures color names match updated categories
)

# Create pie chart without number labels inside
ggplot(data, aes(x = "", y = Value, fill = Category)) +
  geom_bar(width = 1, stat = "identity") +
  coord_polar("y", start = 0) +
  labs(title = "Pie Chart (DOX 0.5 micromolar)", x = NULL, y = NULL) +
  theme_void() +
  scale_fill_manual(values = custom_colors)  # Corrected color mapping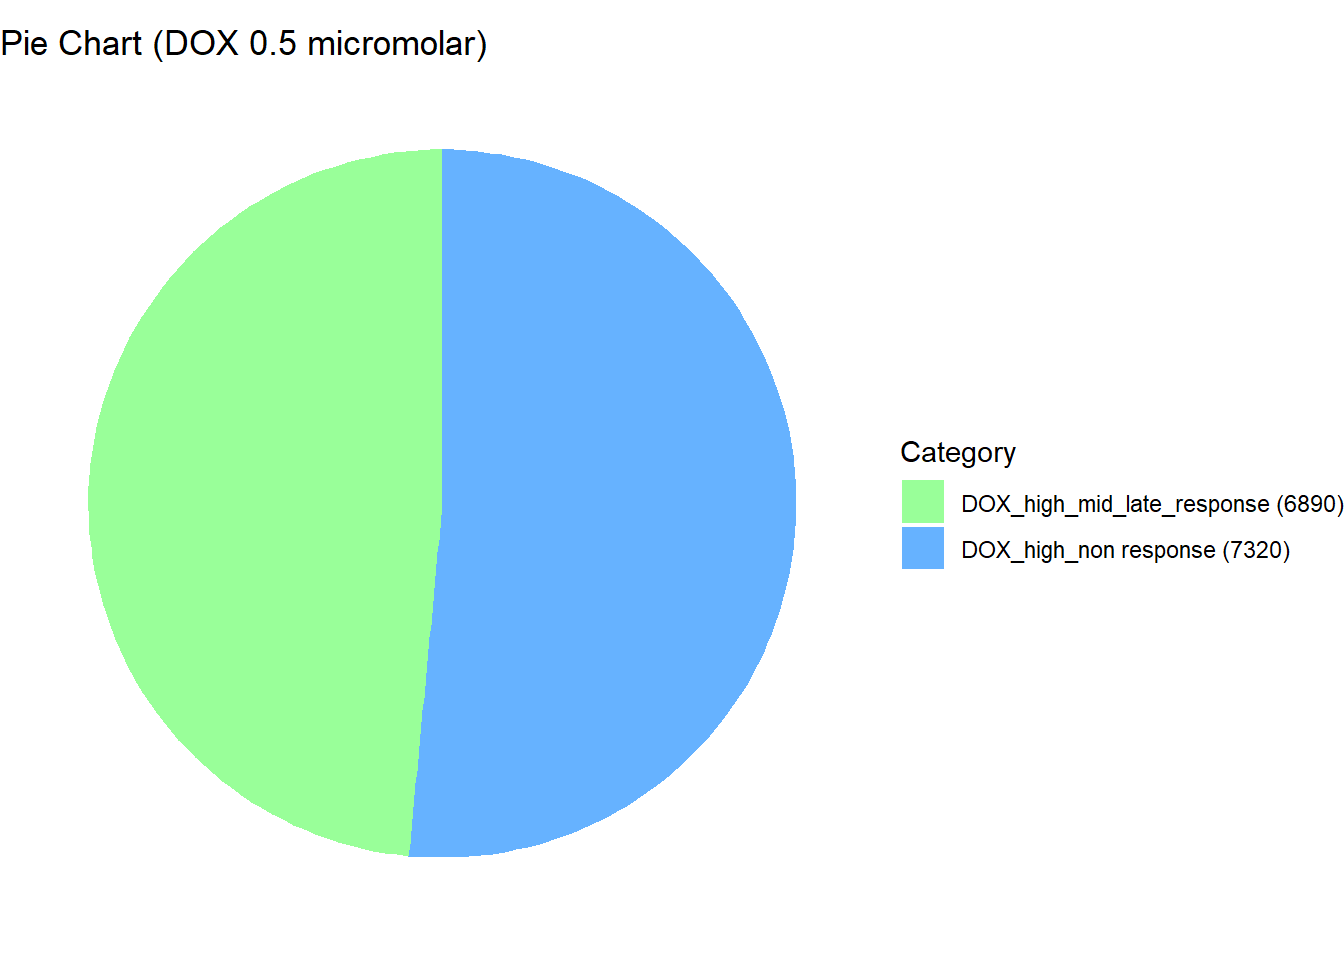
| Version | Author | Date |
|---|---|---|
| 867944a | sayanpaul01 | 2025-02-28 |
Extract Gene Probabilities (DOX 0.5 (3hr, 24hr and 48hr))
# Extract posterior probabilities for genes
gene_prob_DOX_0.5 <- cormotif_DOX_0.5$bestmotif$p.post

rownames(gene_prob_DOX_0.5) <- rownames(Corrmotif_df)


prob_DOX_1_0.5  <- rownames(gene_prob_DOX_0.5[(gene_prob_DOX_0.5[,1] <0.5 & gene_prob_DOX_0.5[,2] <0.5 & gene_prob_DOX_0.5[,3]<0.5),])
length(prob_DOX_1_0.5)
[1] 7320prob_DOX_2_0.5 <- rownames(gene_prob_DOX_0.5[(gene_prob_DOX_0.5[,1] >0.02 & gene_prob_DOX_0.5[,2] >0.5 & gene_prob_DOX_0.5[,3]>0.5),])
length(prob_DOX_2_0.5)[1] 6890📌 Save Corr-motif datasets for Gene Ontology analysis
write.csv(data.frame(Entrez_ID = prob_CX_1_0.1), "data/prob_CX_1_0.1.csv", row.names = FALSE)
write.csv(data.frame(Entrez_ID = prob_CX_2_0.1), "data/prob_CX_2_0.1.csv", row.names = FALSE)
write.csv(data.frame(Entrez_ID = prob_CX_1_0.5), "data/prob_CX_1_0.5.csv", row.names = FALSE)
write.csv(data.frame(Entrez_ID = prob_CX_2_0.5), "data/prob_CX_2_0.5.csv", row.names = FALSE)
write.csv(data.frame(Entrez_ID = prob_DOX_1_0.1), "data/prob_DOX_1_0.1.csv", row.names = FALSE)
write.csv(data.frame(Entrez_ID = prob_DOX_2_0.1), "data/prob_DOX_2_0.1.csv", row.names = FALSE)
write.csv(data.frame(Entrez_ID = prob_DOX_1_0.5), "data/prob_DOX_1_0.5.csv", row.names = FALSE)
write.csv(data.frame(Entrez_ID = prob_DOX_2_0.5), "data/prob_DOX_2_0.5.csv", row.names = FALSE)
📌 Absolute logFC Boxplot (CX response groups)
# Load required libraries
library(dplyr)
library(ggplot2)

# Load Response Groups from CSV Files
prob_CX_1_0.1 <- as.character(read.csv("data/prob_CX_1_0.1.csv")$Entrez_ID)
prob_CX_2_0.1 <- as.character(read.csv("data/prob_CX_2_0.1.csv")$Entrez_ID)
prob_CX_1_0.5 <- as.character(read.csv("data/prob_CX_1_0.5.csv")$Entrez_ID)
prob_CX_2_0.5 <- as.character(read.csv("data/prob_CX_2_0.5.csv")$Entrez_ID)

# Load Datasets (CX 0.1 & CX 0.5 Micromolar)
CX_0.1_3  <- read.csv("data/DEGs/Toptable_CX_0.1_3.csv")
CX_0.1_24 <- read.csv("data/DEGs/Toptable_CX_0.1_24.csv")
CX_0.1_48 <- read.csv("data/DEGs/Toptable_CX_0.1_48.csv")

CX_0.5_3  <- read.csv("data/DEGs/Toptable_CX_0.5_3.csv")
CX_0.5_24 <- read.csv("data/DEGs/Toptable_CX_0.5_24.csv")
CX_0.5_48 <- read.csv("data/DEGs/Toptable_CX_0.5_48.csv")

# Combine Data for CX 0.1 micromolar
CX_toptables_0.1 <- bind_rows(
  CX_0.1_3  %>% mutate(Timepoint = "3hr", Concentration = "CX_0.1 micromolar"),
  CX_0.1_24 %>% mutate(Timepoint = "24hr", Concentration = "CX_0.1 micromolar"),
  CX_0.1_48 %>% mutate(Timepoint = "48hr", Concentration = "CX_0.1 micromolar")
)

# Combine Data for CX 0.5 micromolar
CX_toptables_0.5 <- bind_rows(
  CX_0.5_3  %>% mutate(Timepoint = "3hr", Concentration = "CX_0.5 micromolar"),
  CX_0.5_24 %>% mutate(Timepoint = "24hr", Concentration = "CX_0.5 micromolar"),
  CX_0.5_48 %>% mutate(Timepoint = "48hr", Concentration = "CX_0.5 micromolar")
)

# Assign Response Groups for CX 0.1
CX_toptables_0.1 <- CX_toptables_0.1 %>%
  mutate(
    Response_Group = case_when(
      Entrez_ID %in% prob_CX_1_0.1 ~ "CX_low_non response",
      Entrez_ID %in% prob_CX_2_0.1 ~ "CX_low_mid_late_response",
      TRUE ~ NA_character_
    )
  ) %>%
  filter(!is.na(Response_Group)) %>%
  mutate(absFC = abs(logFC))

# Assign Response Groups for CX 0.5
CX_toptables_0.5 <- CX_toptables_0.5 %>%
  mutate(
    Response_Group = case_when(
      Entrez_ID %in% prob_CX_1_0.5 ~ "CX_high_non response",
      Entrez_ID %in% prob_CX_2_0.5 ~ "CX_high_mid_late_response",
      TRUE ~ NA_character_
    )
  ) %>%
  filter(!is.na(Response_Group)) %>%
  mutate(absFC = abs(logFC))

# Merge Both Concentrations Separately (Keeping them Separate)
CX_toptables_0.1$Category <- "CX_0.1 micromolar"
CX_toptables_0.5$Category <- "CX_0.5 micromolar"

CX_toptables <- bind_rows(CX_toptables_0.1, CX_toptables_0.5)

# Convert Factors for Proper Ordering
CX_toptables$Timepoint <- factor(CX_toptables$Timepoint, levels = c("3hr", "24hr", "48hr"))
CX_toptables$Response_Group <- factor(CX_toptables$Response_Group, levels = c(
  "CX_low_non response", "CX_low_mid_late_response",
  "CX_high_non response", "CX_high_mid_late_response"
))

# **Plot Faceted Boxplot (Each Response Group Separate)**
ggplot(CX_toptables, aes(x = Timepoint, y = absFC, fill = Category)) +
  geom_boxplot() +
  facet_wrap(~ Response_Group, ncol = 2) +  # Two columns, ensuring a 2x2 grid
  theme_bw() +
  labs(
    x = "Timepoints",
    y = "|Log Fold Change|",
    title = "|Log Fold Change| boxplots across CX response groups"
  ) +
  theme(
    plot.title = element_text(size = rel(1.5), hjust = 0.5),
    strip.text = element_text(size = 12, face = "bold")  # Formatting facet labels
  ) +
  scale_fill_manual(values = c("CX_0.1 micromolar" = "blue", "CX_0.5 micromolar" = "red"))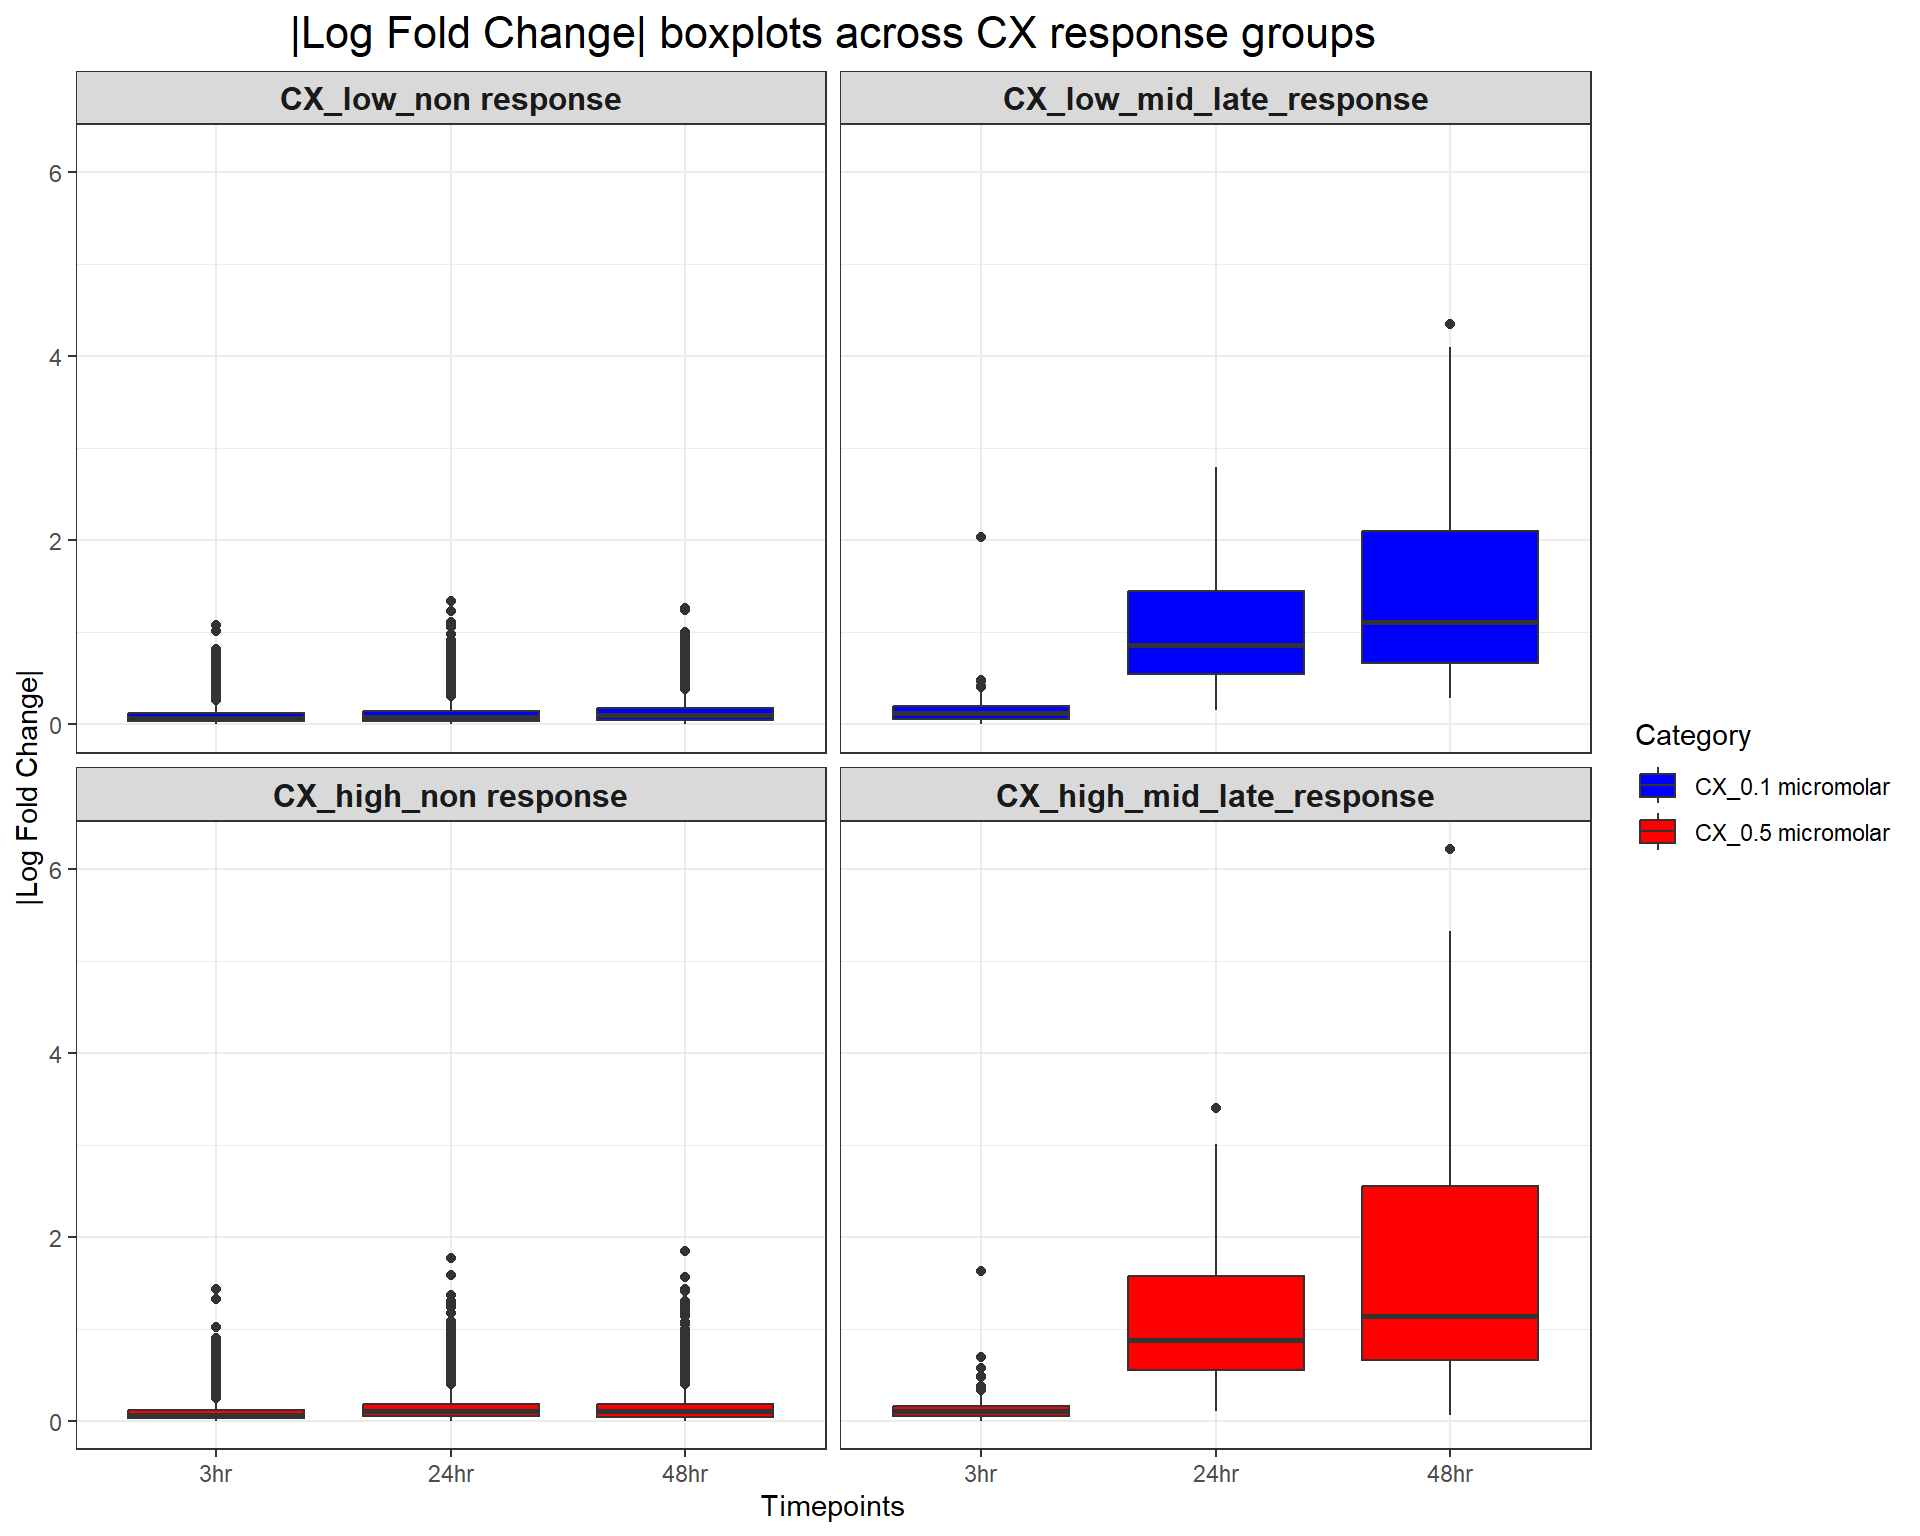
📌 Absolute logFC Boxplot (DOX response groups)
# Load required libraries
library(dplyr)
library(ggplot2)

# Load Response Groups from CSV Files
prob_DOX_1_0.1 <- as.character(read.csv("data/prob_DOX_1_0.1.csv")$Entrez_ID)
prob_DOX_2_0.1 <- as.character(read.csv("data/prob_DOX_2_0.1.csv")$Entrez_ID)
prob_DOX_1_0.5 <- as.character(read.csv("data/prob_DOX_1_0.5.csv")$Entrez_ID)
prob_DOX_2_0.5 <- as.character(read.csv("data/prob_DOX_2_0.5.csv")$Entrez_ID)

# Load Datasets (DOX 0.1 & DOX 0.5 Micromolar)
DOX_0.1_3  <- read.csv("data/DEGs/Toptable_DOX_0.1_3.csv")
DOX_0.1_24 <- read.csv("data/DEGs/Toptable_DOX_0.1_24.csv")
DOX_0.1_48 <- read.csv("data/DEGs/Toptable_DOX_0.1_48.csv")

DOX_0.5_3  <- read.csv("data/DEGs/Toptable_DOX_0.5_3.csv")
DOX_0.5_24 <- read.csv("data/DEGs/Toptable_DOX_0.5_24.csv")
DOX_0.5_48 <- read.csv("data/DEGs/Toptable_DOX_0.5_48.csv")

# Combine Data for DOX 0.1 micromolar
DOX_toptables_0.1 <- bind_rows(
  DOX_0.1_3  %>% mutate(Timepoint = "3hr", Concentration = "DOX_0.1 micromolar"),
  DOX_0.1_24 %>% mutate(Timepoint = "24hr", Concentration = "DOX_0.1 micromolar"),
  DOX_0.1_48 %>% mutate(Timepoint = "48hr", Concentration = "DOX_0.1 micromolar")
)

# Combine Data for DOX 0.5 micromolar
DOX_toptables_0.5 <- bind_rows(
  DOX_0.5_3  %>% mutate(Timepoint = "3hr", Concentration = "DOX_0.5 micromolar"),
  DOX_0.5_24 %>% mutate(Timepoint = "24hr", Concentration = "DOX_0.5 micromolar"),
  DOX_0.5_48 %>% mutate(Timepoint = "48hr", Concentration = "DOX_0.5 micromolar")
)

# Assign Response Groups for DOX 0.1
DOX_toptables_0.1 <- DOX_toptables_0.1 %>%
  mutate(
    Response_Group = case_when(
      Entrez_ID %in% prob_DOX_1_0.1 ~ "DOX_low_non response",
      Entrez_ID %in% prob_DOX_2_0.1 ~ "DOX_low_mid_late_response",
      TRUE ~ NA_character_
    )
  ) %>%
  filter(!is.na(Response_Group)) %>%
  mutate(absFC = abs(logFC))

# Assign Response Groups for DOX 0.5
DOX_toptables_0.5 <- DOX_toptables_0.5 %>%
  mutate(
    Response_Group = case_when(
      Entrez_ID %in% prob_DOX_1_0.5 ~ "DOX_high_non response",
      Entrez_ID %in% prob_DOX_2_0.5 ~ "DOX_high_mid_late_response",
      TRUE ~ NA_character_
    )
  ) %>%
  filter(!is.na(Response_Group)) %>%
  mutate(absFC = abs(logFC))

# Merge Both Concentrations Separately (Keeping them Separate)
DOX_toptables_0.1$Category <- "DOX_0.1 micromolar"
DOX_toptables_0.5$Category <- "DOX_0.5 micromolar"

DOX_toptables <- bind_rows(DOX_toptables_0.1, DOX_toptables_0.5)

# Convert Factors for Proper Ordering
DOX_toptables$Timepoint <- factor(DOX_toptables$Timepoint, levels = c("3hr", "24hr", "48hr"))
DOX_toptables$Response_Group <- factor(DOX_toptables$Response_Group, levels = c(
  "DOX_low_non response", "DOX_low_mid_late_response",
  "DOX_high_non response", "DOX_high_mid_late_response"
))

# **Plot Faceted Boxplot (Each Response Group Separate)**
ggplot(DOX_toptables, aes(x = Timepoint, y = absFC, fill = Category)) +
  geom_boxplot() +
  facet_wrap(~ Response_Group, ncol = 2) +  # Two columns, ensuring a 2x2 grid
  theme_bw() +
  labs(
    x = "Timepoints",
    y = "|Log Fold Change|",
    title = "|Log Fold Change| boxplots across DOX response groups"
  ) +
  theme(
    plot.title = element_text(size = rel(1.5), hjust = 0.5),
    strip.text = element_text(size = 12, face = "bold")  # Formatting facet labels
  ) +
  scale_fill_manual(values = c("DOX_0.1 micromolar" = "blue", "DOX_0.5 micromolar" = "red"))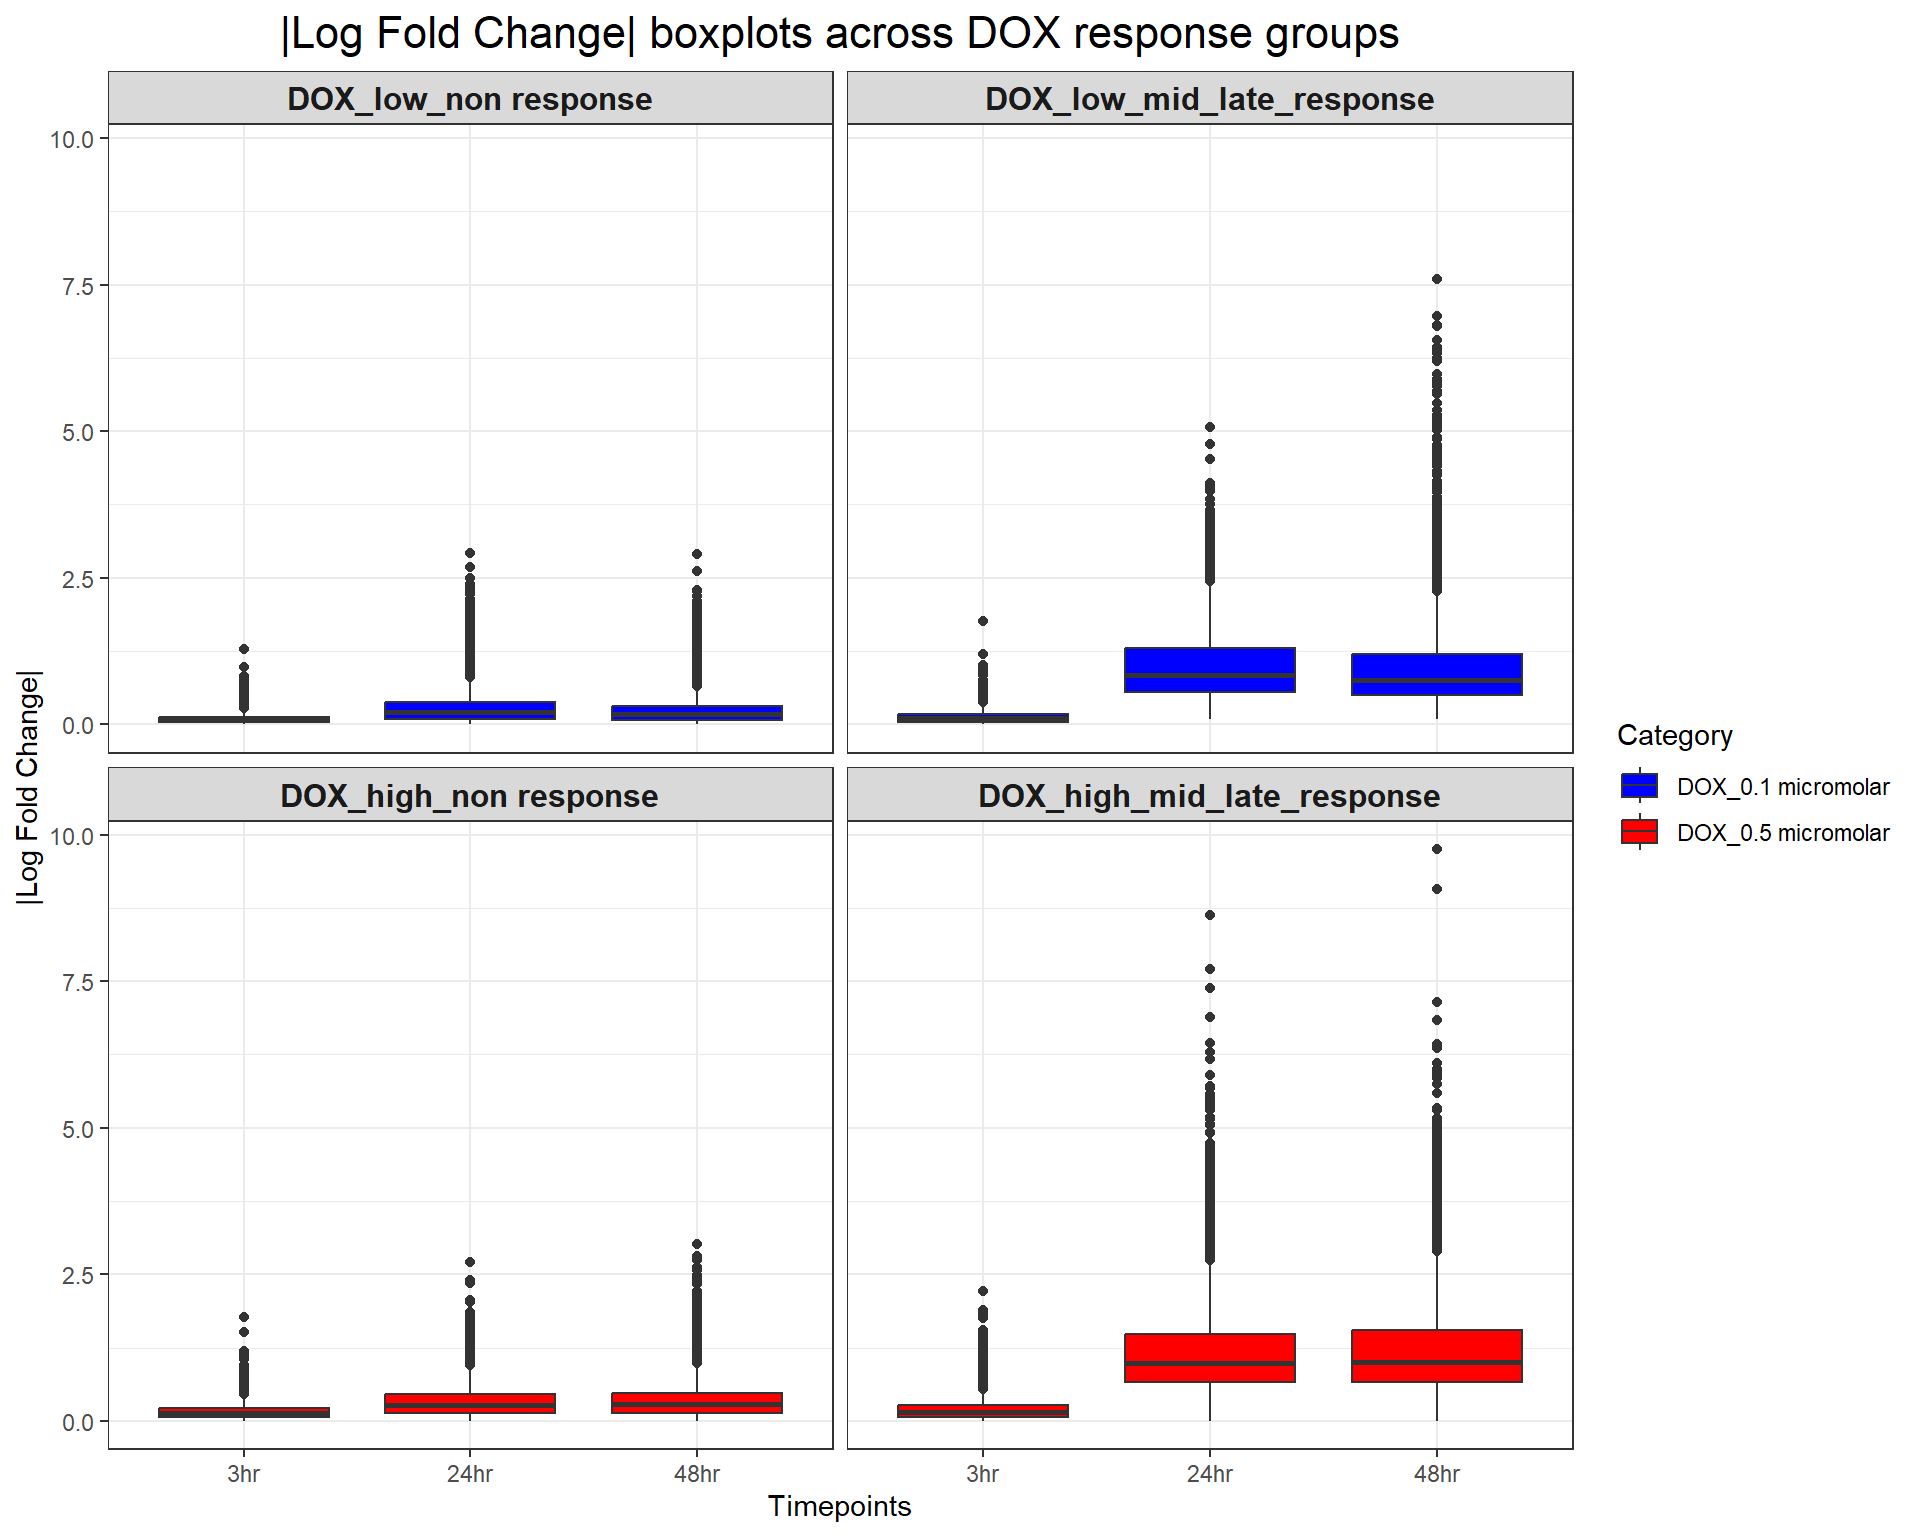
| Version | Author | Date |
|---|---|---|
| fb09f5f | sayanpaul01 | 2025-03-03 |
📌 logFC Boxplot (CX response groups)
# Load required libraries
library(dplyr)
library(ggplot2)

# Load Response Groups from CSV Files
prob_CX_1_0.1 <- as.character(read.csv("data/prob_CX_1_0.1.csv")$Entrez_ID)
prob_CX_2_0.1 <- as.character(read.csv("data/prob_CX_2_0.1.csv")$Entrez_ID)
prob_CX_1_0.5 <- as.character(read.csv("data/prob_CX_1_0.5.csv")$Entrez_ID)
prob_CX_2_0.5 <- as.character(read.csv("data/prob_CX_2_0.5.csv")$Entrez_ID)

# Load Datasets (CX 0.1 & CX 0.5 Micromolar)
CX_0.1_3  <- read.csv("data/DEGs/Toptable_CX_0.1_3.csv")
CX_0.1_24 <- read.csv("data/DEGs/Toptable_CX_0.1_24.csv")
CX_0.1_48 <- read.csv("data/DEGs/Toptable_CX_0.1_48.csv")

CX_0.5_3  <- read.csv("data/DEGs/Toptable_CX_0.5_3.csv")
CX_0.5_24 <- read.csv("data/DEGs/Toptable_CX_0.5_24.csv")
CX_0.5_48 <- read.csv("data/DEGs/Toptable_CX_0.5_48.csv")

# Combine Data for CX 0.1 micromolar
CX_toptables_0.1 <- bind_rows(
  CX_0.1_3  %>% mutate(Timepoint = "3hr", Concentration = "CX_0.1 micromolar"),
  CX_0.1_24 %>% mutate(Timepoint = "24hr", Concentration = "CX_0.1 micromolar"),
  CX_0.1_48 %>% mutate(Timepoint = "48hr", Concentration = "CX_0.1 micromolar")
)

# Combine Data for CX 0.5 micromolar
CX_toptables_0.5 <- bind_rows(
  CX_0.5_3  %>% mutate(Timepoint = "3hr", Concentration = "CX_0.5 micromolar"),
  CX_0.5_24 %>% mutate(Timepoint = "24hr", Concentration = "CX_0.5 micromolar"),
  CX_0.5_48 %>% mutate(Timepoint = "48hr", Concentration = "CX_0.5 micromolar")
)

# Assign Response Groups for CX 0.1
CX_toptables_0.1 <- CX_toptables_0.1 %>%
  mutate(
    Response_Group = case_when(
      Entrez_ID %in% prob_CX_1_0.1 ~ "CX_low_non response",
      Entrez_ID %in% prob_CX_2_0.1 ~ "CX_low_mid_late_response",
      TRUE ~ NA_character_
    )
  ) %>%
  filter(!is.na(Response_Group))

# Assign Response Groups for CX 0.5
CX_toptables_0.5 <- CX_toptables_0.5 %>%
  mutate(
    Response_Group = case_when(
      Entrez_ID %in% prob_CX_1_0.5 ~ "CX_high_non response",
      Entrez_ID %in% prob_CX_2_0.5 ~ "CX_high_mid_late_response",
      TRUE ~ NA_character_
    )
  ) %>%
  filter(!is.na(Response_Group))

# Merge Both Concentrations Separately (Keeping them Separate)
CX_toptables_0.1$Category <- "CX_0.1 micromolar"
CX_toptables_0.5$Category <- "CX_0.5 micromolar"

CX_toptables <- bind_rows(CX_toptables_0.1, CX_toptables_0.5)

# Convert Factors for Proper Ordering
CX_toptables$Timepoint <- factor(CX_toptables$Timepoint, levels = c("3hr", "24hr", "48hr"))
CX_toptables$Response_Group <- factor(CX_toptables$Response_Group, levels = c(
  "CX_low_non response", "CX_low_mid_late_response",
  "CX_high_non response", "CX_high_mid_late_response"
))

# **Plot Faceted Boxplot (Using LogFC)**
ggplot(CX_toptables, aes(x = Timepoint, y = logFC, fill = Category)) +
  geom_boxplot() +
  facet_wrap(~ Response_Group, ncol = 2) +  # Two columns, ensuring a 2x2 grid
  theme_bw() +
  labs(
    x = "Timepoints",
    y = "Log Fold Change",
    title = "Log Fold Change Boxplots Across CX Response Groups"
  ) +
  theme(
    plot.title = element_text(size = rel(1.5), hjust = 0.5),
    strip.text = element_text(size = 12, face = "bold")  # Formatting facet labels
  ) +
  scale_fill_manual(values = c("CX_0.1 micromolar" = "blue", "CX_0.5 micromolar" = "red"))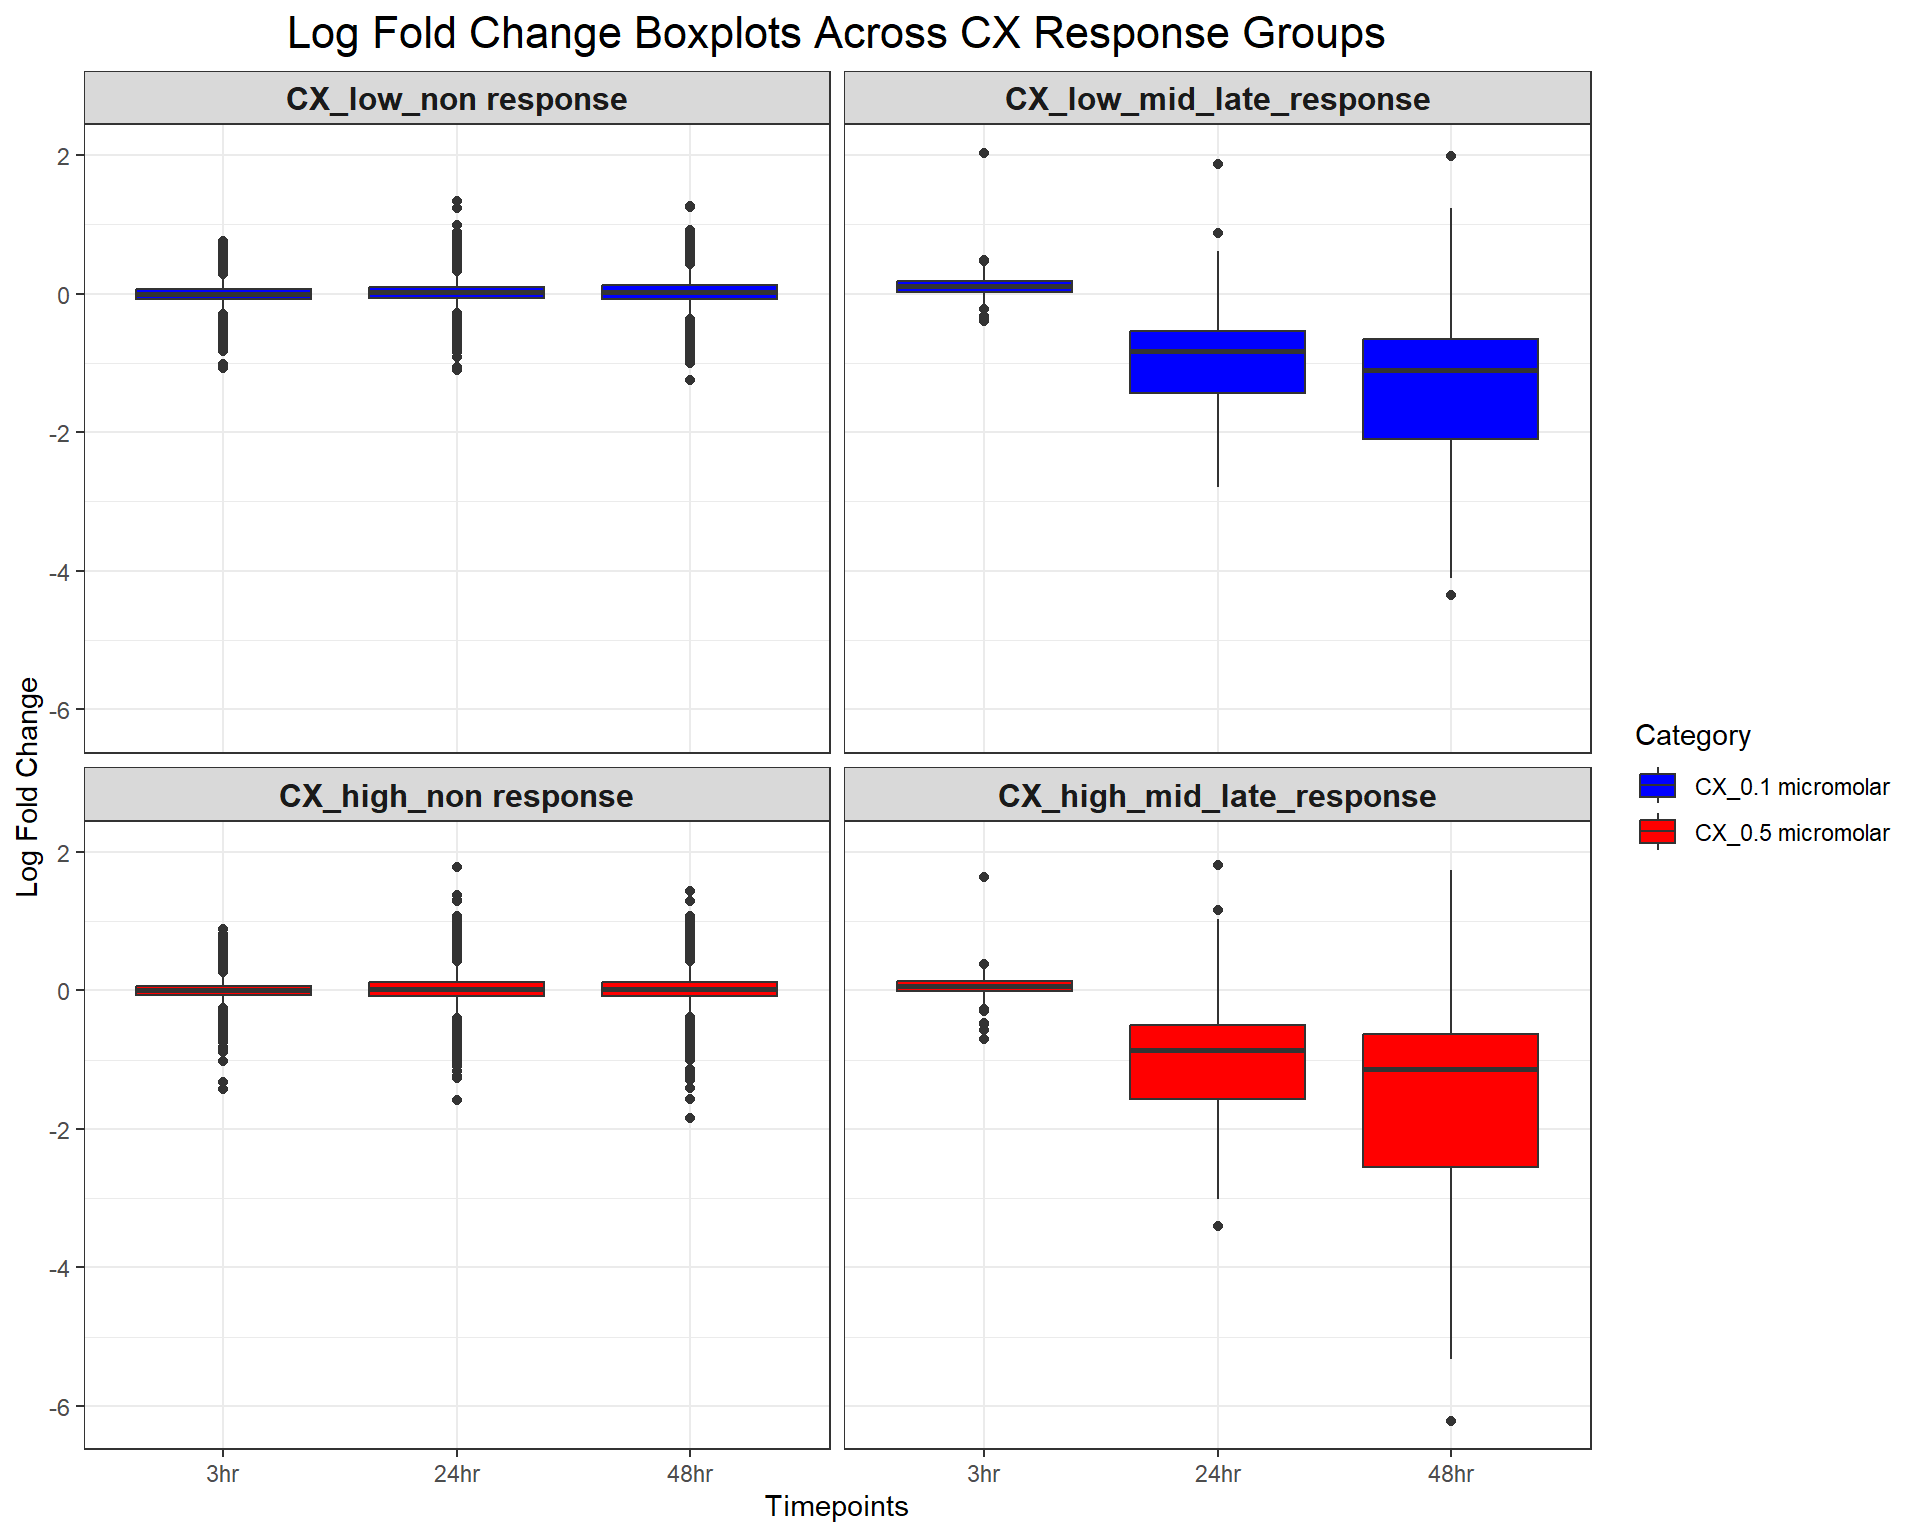
| Version | Author | Date |
|---|---|---|
| fb09f5f | sayanpaul01 | 2025-03-03 |
📌 logFC Boxplot (DOX response groups)
# Load required libraries
library(dplyr)
library(ggplot2)

# Load Response Groups from CSV Files
prob_DOX_1_0.1 <- as.character(read.csv("data/prob_DOX_1_0.1.csv")$Entrez_ID)
prob_DOX_2_0.1 <- as.character(read.csv("data/prob_DOX_2_0.1.csv")$Entrez_ID)
prob_DOX_1_0.5 <- as.character(read.csv("data/prob_DOX_1_0.5.csv")$Entrez_ID)
prob_DOX_2_0.5 <- as.character(read.csv("data/prob_DOX_2_0.5.csv")$Entrez_ID)

# Load Datasets (DOX 0.1 & DOX 0.5 Micromolar)
DOX_0.1_3  <- read.csv("data/DEGs/Toptable_DOX_0.1_3.csv")
DOX_0.1_24 <- read.csv("data/DEGs/Toptable_DOX_0.1_24.csv")
DOX_0.1_48 <- read.csv("data/DEGs/Toptable_DOX_0.1_48.csv")

DOX_0.5_3  <- read.csv("data/DEGs/Toptable_DOX_0.5_3.csv")
DOX_0.5_24 <- read.csv("data/DEGs/Toptable_DOX_0.5_24.csv")
DOX_0.5_48 <- read.csv("data/DEGs/Toptable_DOX_0.5_48.csv")

# Combine Data for DOX 0.1 micromolar
DOX_toptables_0.1 <- bind_rows(
  DOX_0.1_3  %>% mutate(Timepoint = "3hr", Concentration = "DOX_0.1 micromolar"),
  DOX_0.1_24 %>% mutate(Timepoint = "24hr", Concentration = "DOX_0.1 micromolar"),
  DOX_0.1_48 %>% mutate(Timepoint = "48hr", Concentration = "DOX_0.1 micromolar")
)

# Combine Data for DOX 0.5 micromolar
DOX_toptables_0.5 <- bind_rows(
  DOX_0.5_3  %>% mutate(Timepoint = "3hr", Concentration = "DOX_0.5 micromolar"),
  DOX_0.5_24 %>% mutate(Timepoint = "24hr", Concentration = "DOX_0.5 micromolar"),
  DOX_0.5_48 %>% mutate(Timepoint = "48hr", Concentration = "DOX_0.5 micromolar")
)

# Assign Response Groups for DOX 0.1
DOX_toptables_0.1 <- DOX_toptables_0.1 %>%
  mutate(
    Response_Group = case_when(
      Entrez_ID %in% prob_DOX_1_0.1 ~ "DOX_low_non response",
      Entrez_ID %in% prob_DOX_2_0.1 ~ "DOX_low_mid_late_response",
      TRUE ~ NA_character_
    )
  ) %>%
  filter(!is.na(Response_Group))

# Assign Response Groups for DOX 0.5
DOX_toptables_0.5 <- DOX_toptables_0.5 %>%
  mutate(
    Response_Group = case_when(
      Entrez_ID %in% prob_DOX_1_0.5 ~ "DOX_high_non response",
      Entrez_ID %in% prob_DOX_2_0.5 ~ "DOX_high_mid_late_response",
      TRUE ~ NA_character_
    )
  ) %>%
  filter(!is.na(Response_Group))

# Merge Both Concentrations Separately (Keeping them Separate)
DOX_toptables_0.1$Category <- "DOX_0.1 micromolar"
DOX_toptables_0.5$Category <- "DOX_0.5 micromolar"

DOX_toptables <- bind_rows(DOX_toptables_0.1, DOX_toptables_0.5)

# Convert Factors for Proper Ordering
DOX_toptables$Timepoint <- factor(DOX_toptables$Timepoint, levels = c("3hr", "24hr", "48hr"))
DOX_toptables$Response_Group <- factor(DOX_toptables$Response_Group, levels = c(
  "DOX_low_non response", "DOX_low_mid_late_response",
  "DOX_high_non response", "DOX_high_mid_late_response"
))

# **Plot Faceted Boxplot (Using LogFC)**
ggplot(DOX_toptables, aes(x = Timepoint, y = logFC, fill = Category)) +
  geom_boxplot() +
  facet_wrap(~ Response_Group, ncol = 2) +  # Two columns, ensuring a 2x2 grid
  theme_bw() +
  labs(
    x = "Timepoints",
    y = "Log Fold Change",
    title = "Log Fold Change Boxplots Across DOX Response Groups"
  ) +
  theme(
    plot.title = element_text(size = rel(1.5), hjust = 0.5),
    strip.text = element_text(size = 12, face = "bold")  # Formatting facet labels
  ) +
  scale_fill_manual(values = c("DOX_0.1 micromolar" = "blue", "DOX_0.5 micromolar" = "red"))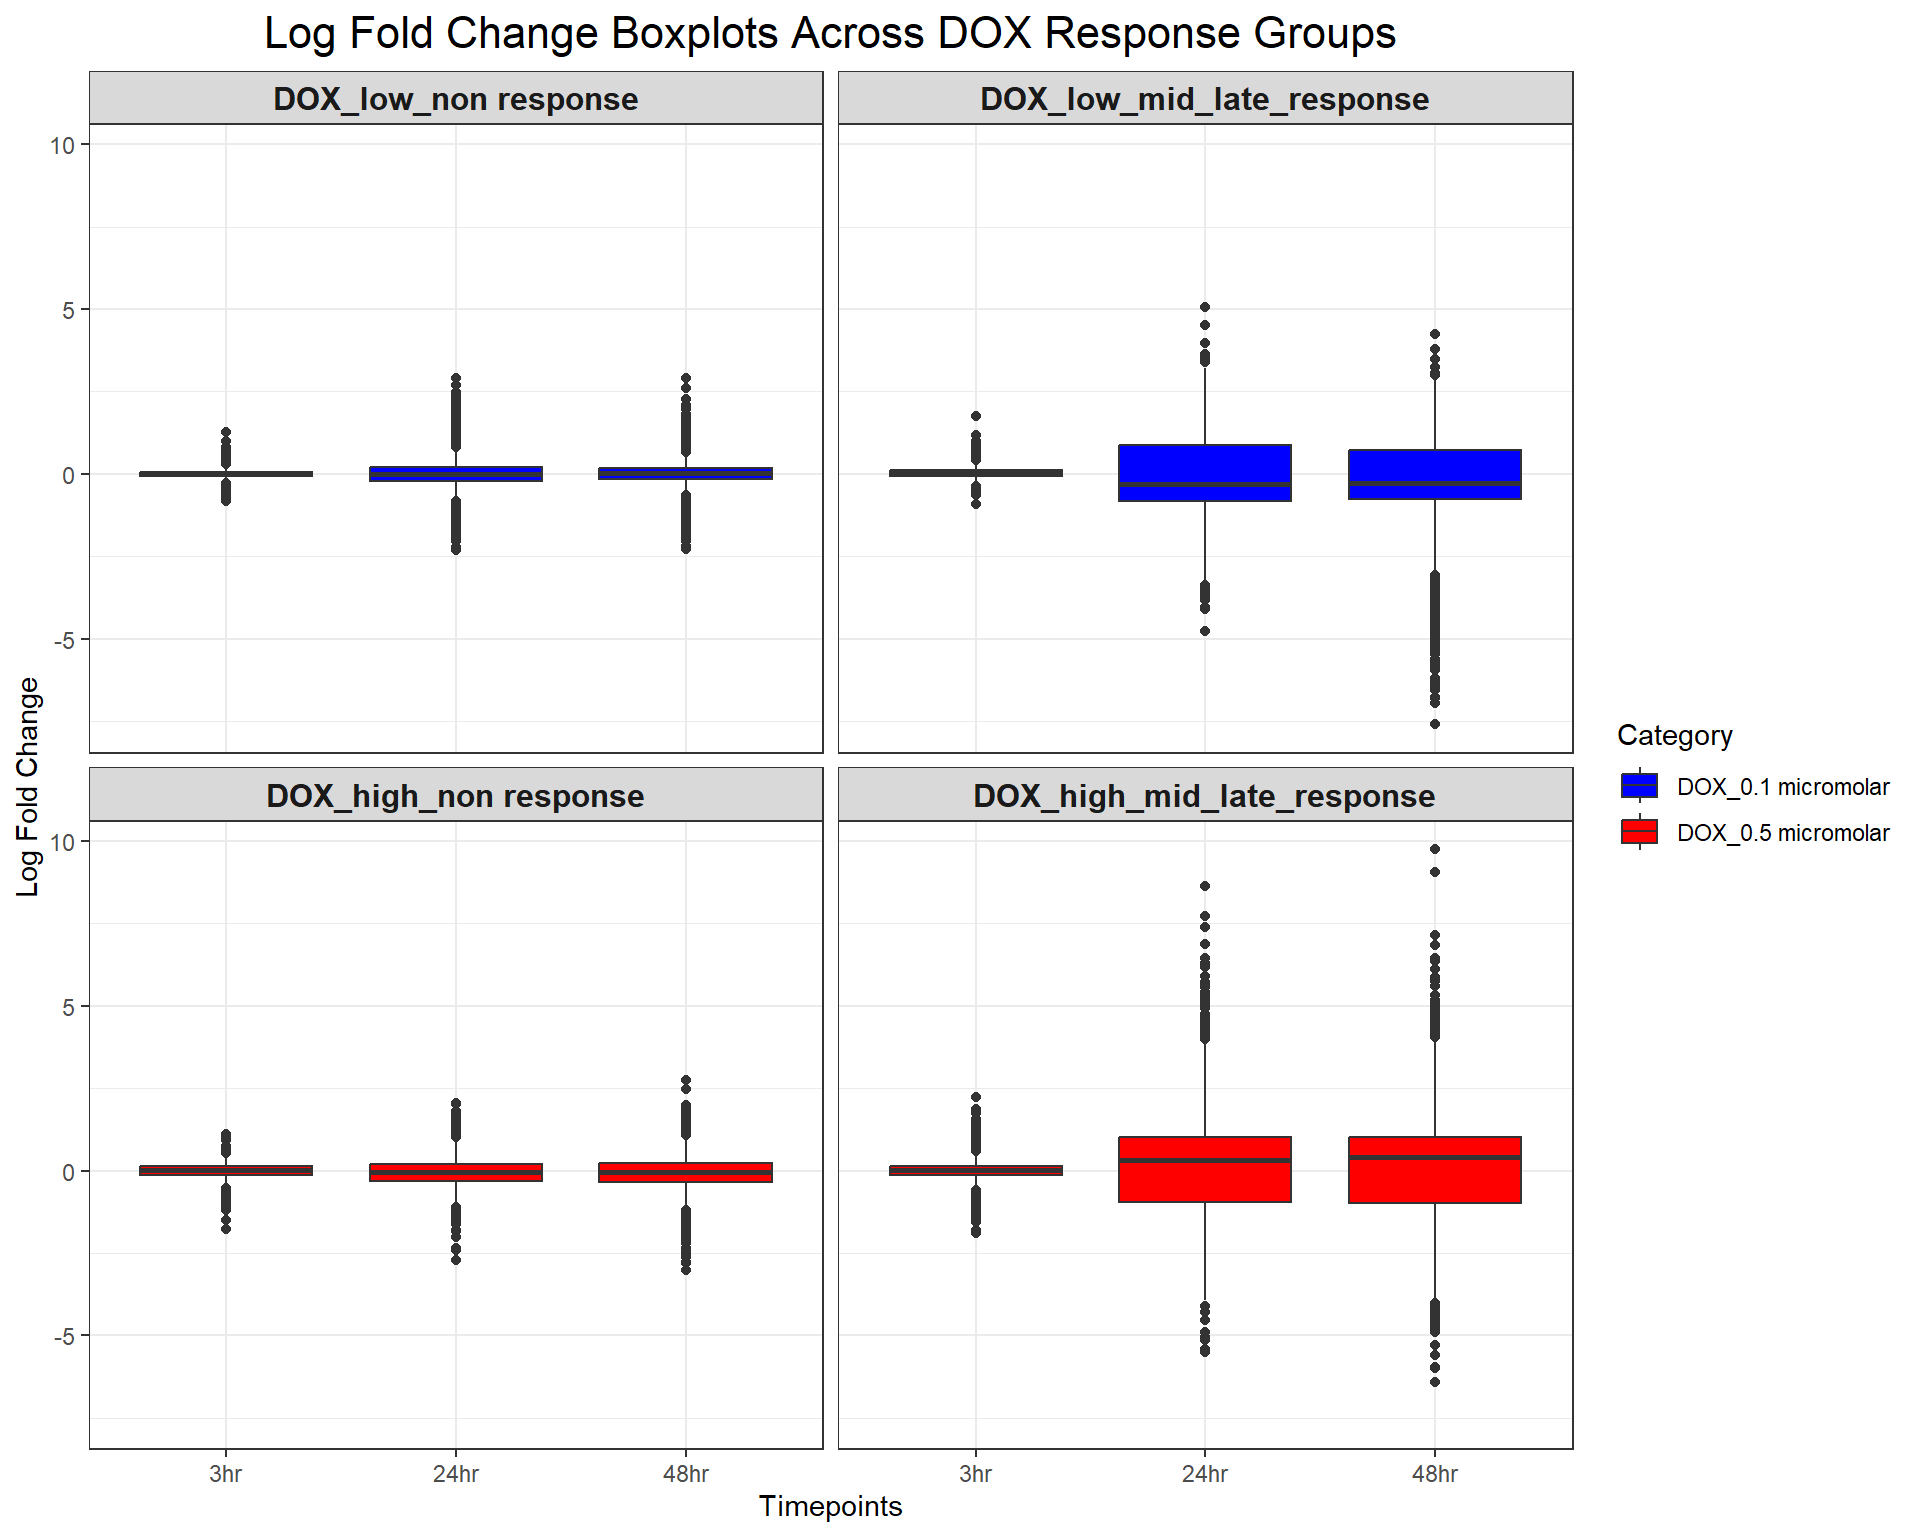
| Version | Author | Date |
|---|---|---|
| fb09f5f | sayanpaul01 | 2025-03-03 |
📌 Mean (Abs logFC) across timepoints (CX response groups)
# Load required libraries
# Load required libraries
library(dplyr)
library(ggplot2)

# Load Response Groups from CSV Files
prob_CX_1_0.1 <- as.character(read.csv("data/prob_CX_1_0.1.csv")$Entrez_ID)
prob_CX_2_0.1 <- as.character(read.csv("data/prob_CX_2_0.1.csv")$Entrez_ID)
prob_CX_1_0.5 <- as.character(read.csv("data/prob_CX_1_0.5.csv")$Entrez_ID)
prob_CX_2_0.5 <- as.character(read.csv("data/prob_CX_2_0.5.csv")$Entrez_ID)

# Load Datasets (CX 0.1 & CX 0.5 Micromolar)
CX_0.1_3  <- read.csv("data/DEGs/Toptable_CX_0.1_3.csv")
CX_0.1_24 <- read.csv("data/DEGs/Toptable_CX_0.1_24.csv")
CX_0.1_48 <- read.csv("data/DEGs/Toptable_CX_0.1_48.csv")

CX_0.5_3  <- read.csv("data/DEGs/Toptable_CX_0.5_3.csv")
CX_0.5_24 <- read.csv("data/DEGs/Toptable_CX_0.5_24.csv")
CX_0.5_48 <- read.csv("data/DEGs/Toptable_CX_0.5_48.csv")

# Combine Data for CX 0.1 micromolar
CX_toptables_0.1 <- bind_rows(
  CX_0.1_3  %>% mutate(Timepoint = "3hr", Concentration = "CX_0.1 micromolar"),
  CX_0.1_24 %>% mutate(Timepoint = "24hr", Concentration = "CX_0.1 micromolar"),
  CX_0.1_48 %>% mutate(Timepoint = "48hr", Concentration = "CX_0.1 micromolar")
)

# Combine Data for CX 0.5 micromolar
CX_toptables_0.5 <- bind_rows(
  CX_0.5_3  %>% mutate(Timepoint = "3hr", Concentration = "CX_0.5 micromolar"),
  CX_0.5_24 %>% mutate(Timepoint = "24hr", Concentration = "CX_0.5 micromolar"),
  CX_0.5_48 %>% mutate(Timepoint = "48hr", Concentration = "CX_0.5 micromolar")
)

# Assign Response Groups for CX 0.1
CX_toptables_0.1 <- CX_toptables_0.1 %>%
  mutate(
    Response_Group = case_when(
      Entrez_ID %in% prob_CX_1_0.1 ~ "CX_low_non response",
      Entrez_ID %in% prob_CX_2_0.1 ~ "CX_low_mid_late_response",
      TRUE ~ NA_character_
    )
  ) %>%
  filter(!is.na(Response_Group)) %>%
  mutate(absFC = abs(logFC))

# Assign Response Groups for CX 0.5
CX_toptables_0.5 <- CX_toptables_0.5 %>%
  mutate(
    Response_Group = case_when(
      Entrez_ID %in% prob_CX_1_0.5 ~ "CX_high_non response",
      Entrez_ID %in% prob_CX_2_0.5 ~ "CX_high_mid_late_response",
      TRUE ~ NA_character_
    )
  ) %>%
  filter(!is.na(Response_Group)) %>%
  mutate(absFC = abs(logFC))

# Merge Both Concentrations Separately (Keeping them Separate)
CX_toptables_0.1$Category <- "CX_0.1 micromolar"
CX_toptables_0.5$Category <- "CX_0.5 micromolar"

CX_toptables <- bind_rows(CX_toptables_0.1, CX_toptables_0.5)

# Convert Factors for Proper Ordering
CX_toptables$Timepoint <- factor(CX_toptables$Timepoint, levels = c("3hr", "24hr", "48hr"))
CX_toptables$Response_Group <- factor(CX_toptables$Response_Group, levels = c(
  "CX_low_non response", "CX_low_mid_late_response",
  "CX_high_non response", "CX_high_mid_late_response"
))

# Calculate Mean Absolute logFC per Response Group, Timepoint, and Concentration
mean_absFC <- CX_toptables %>%
  group_by(Response_Group, Timepoint, Category) %>%
  summarise(mean_absFC = mean(absFC, na.rm = TRUE), .groups = "drop")

# **Plot Mean Absolute logFC Line Plot (Y-limit: 0 to 2)**
ggplot(mean_absFC, aes(x = Timepoint, y = mean_absFC, color = Category, group = Category)) +
  geom_line(size = 1.2) +
  geom_point(size = 3) +
  facet_wrap(~ Response_Group, ncol = 2) +  # Two columns, ensuring a 2x2 grid
  theme_bw() +
  labs(
    x = "Timepoints",
    y = "Mean |Log Fold Change|",
    title = "Mean |logFC| Across CX Response Groups"
  ) +
  theme(
    plot.title = element_text(size = rel(1.5), hjust = 0.5),
    strip.text = element_text(size = 12, face = "bold")  # Formatting facet labels
  ) +
  scale_color_manual(values = c("CX_0.1 micromolar" = "blue", "CX_0.5 micromolar" = "red")) +
  ylim(0, 2)  # Set Y-axis limits from 0 to 2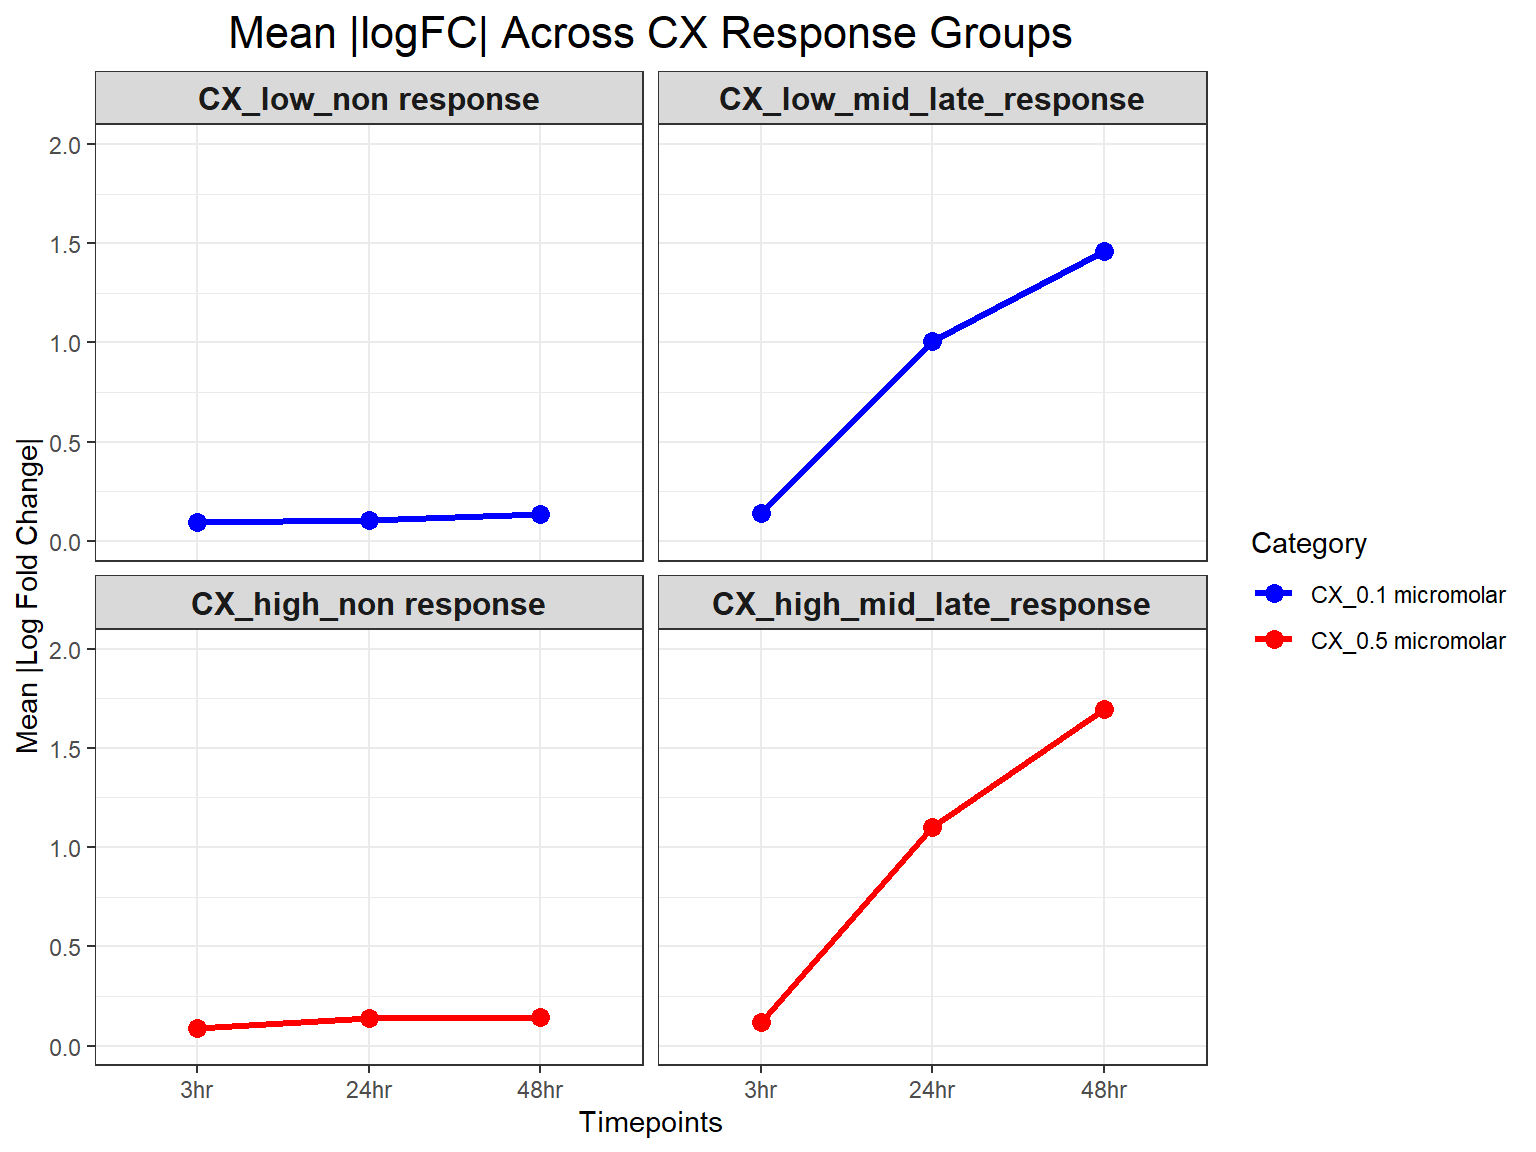
| Version | Author | Date |
|---|---|---|
| fb09f5f | sayanpaul01 | 2025-03-03 |
📌 Mean (Abs logFC) across timepoints (DOX response groups)
# Load required libraries
library(dplyr)
library(ggplot2)

# Load Response Groups from CSV Files
prob_DOX_1_0.1 <- as.character(read.csv("data/prob_DOX_1_0.1.csv")$Entrez_ID)
prob_DOX_2_0.1 <- as.character(read.csv("data/prob_DOX_2_0.1.csv")$Entrez_ID)
prob_DOX_1_0.5 <- as.character(read.csv("data/prob_DOX_1_0.5.csv")$Entrez_ID)
prob_DOX_2_0.5 <- as.character(read.csv("data/prob_DOX_2_0.5.csv")$Entrez_ID)

# Load Datasets (DOX 0.1 & DOX 0.5 Micromolar)
DOX_0.1_3  <- read.csv("data/DEGs/Toptable_DOX_0.1_3.csv")
DOX_0.1_24 <- read.csv("data/DEGs/Toptable_DOX_0.1_24.csv")
DOX_0.1_48 <- read.csv("data/DEGs/Toptable_DOX_0.1_48.csv")

DOX_0.5_3  <- read.csv("data/DEGs/Toptable_DOX_0.5_3.csv")
DOX_0.5_24 <- read.csv("data/DEGs/Toptable_DOX_0.5_24.csv")
DOX_0.5_48 <- read.csv("data/DEGs/Toptable_DOX_0.5_48.csv")

# Combine Data for DOX 0.1 micromolar
DOX_toptables_0.1 <- bind_rows(
  DOX_0.1_3  %>% mutate(Timepoint = "3hr", Concentration = "DOX_0.1 micromolar"),
  DOX_0.1_24 %>% mutate(Timepoint = "24hr", Concentration = "DOX_0.1 micromolar"),
  DOX_0.1_48 %>% mutate(Timepoint = "48hr", Concentration = "DOX_0.1 micromolar")
)

# Combine Data for DOX 0.5 micromolar
DOX_toptables_0.5 <- bind_rows(
  DOX_0.5_3  %>% mutate(Timepoint = "3hr", Concentration = "DOX_0.5 micromolar"),
  DOX_0.5_24 %>% mutate(Timepoint = "24hr", Concentration = "DOX_0.5 micromolar"),
  DOX_0.5_48 %>% mutate(Timepoint = "48hr", Concentration = "DOX_0.5 micromolar")
)

# Assign Response Groups for DOX 0.1
DOX_toptables_0.1 <- DOX_toptables_0.1 %>%
  mutate(
    Response_Group = case_when(
      Entrez_ID %in% prob_DOX_1_0.1 ~ "DOX_low_non response",
      Entrez_ID %in% prob_DOX_2_0.1 ~ "DOX_low_mid_late_response",
      TRUE ~ NA_character_
    )
  ) %>%
  filter(!is.na(Response_Group)) %>%
  mutate(absFC = abs(logFC))

# Assign Response Groups for DOX 0.5
DOX_toptables_0.5 <- DOX_toptables_0.5 %>%
  mutate(
    Response_Group = case_when(
      Entrez_ID %in% prob_DOX_1_0.5 ~ "DOX_high_non response",
      Entrez_ID %in% prob_DOX_2_0.5 ~ "DOX_high_mid_late_response",
      TRUE ~ NA_character_
    )
  ) %>%
  filter(!is.na(Response_Group)) %>%
  mutate(absFC = abs(logFC))

# Merge Both Concentrations Separately (Keeping them Separate)
DOX_toptables_0.1$Category <- "DOX_0.1 micromolar"
DOX_toptables_0.5$Category <- "DOX_0.5 micromolar"

DOX_toptables <- bind_rows(DOX_toptables_0.1, DOX_toptables_0.5)

# Convert Factors for Proper Ordering
DOX_toptables$Timepoint <- factor(DOX_toptables$Timepoint, levels = c("3hr", "24hr", "48hr"))
DOX_toptables$Response_Group <- factor(DOX_toptables$Response_Group, levels = c(
  "DOX_low_non response", "DOX_low_mid_late_response",
  "DOX_high_non response", "DOX_high_mid_late_response"
))

# Calculate Mean Absolute logFC per Response Group, Timepoint, and Concentration
mean_absFC <- DOX_toptables %>%
  group_by(Response_Group, Timepoint, Category) %>%
  summarise(mean_absFC = mean(absFC, na.rm = TRUE), .groups = "drop")

# **Plot Mean Absolute logFC Line Plot (Y-limit: 0 to 2)**
ggplot(mean_absFC, aes(x = Timepoint, y = mean_absFC, color = Category, group = Category)) +
  geom_line(size = 1.2) +
  geom_point(size = 3) +
  facet_wrap(~ Response_Group, ncol = 2) +  # Two columns, ensuring a 2x2 grid
  theme_bw() +
  labs(
    x = "Timepoints",
    y = "Mean |Log Fold Change|",
    title = "Mean |logFC| Across DOX Response Groups"
  ) +
  theme(
    plot.title = element_text(size = rel(1.5), hjust = 0.5),
    strip.text = element_text(size = 12, face = "bold")  # Formatting facet labels
  ) +
  scale_color_manual(values = c("DOX_0.1 micromolar" = "blue", "DOX_0.5 micromolar" = "red")) +
  ylim(0, 2)  # Set Y-axis limits from 0 to 2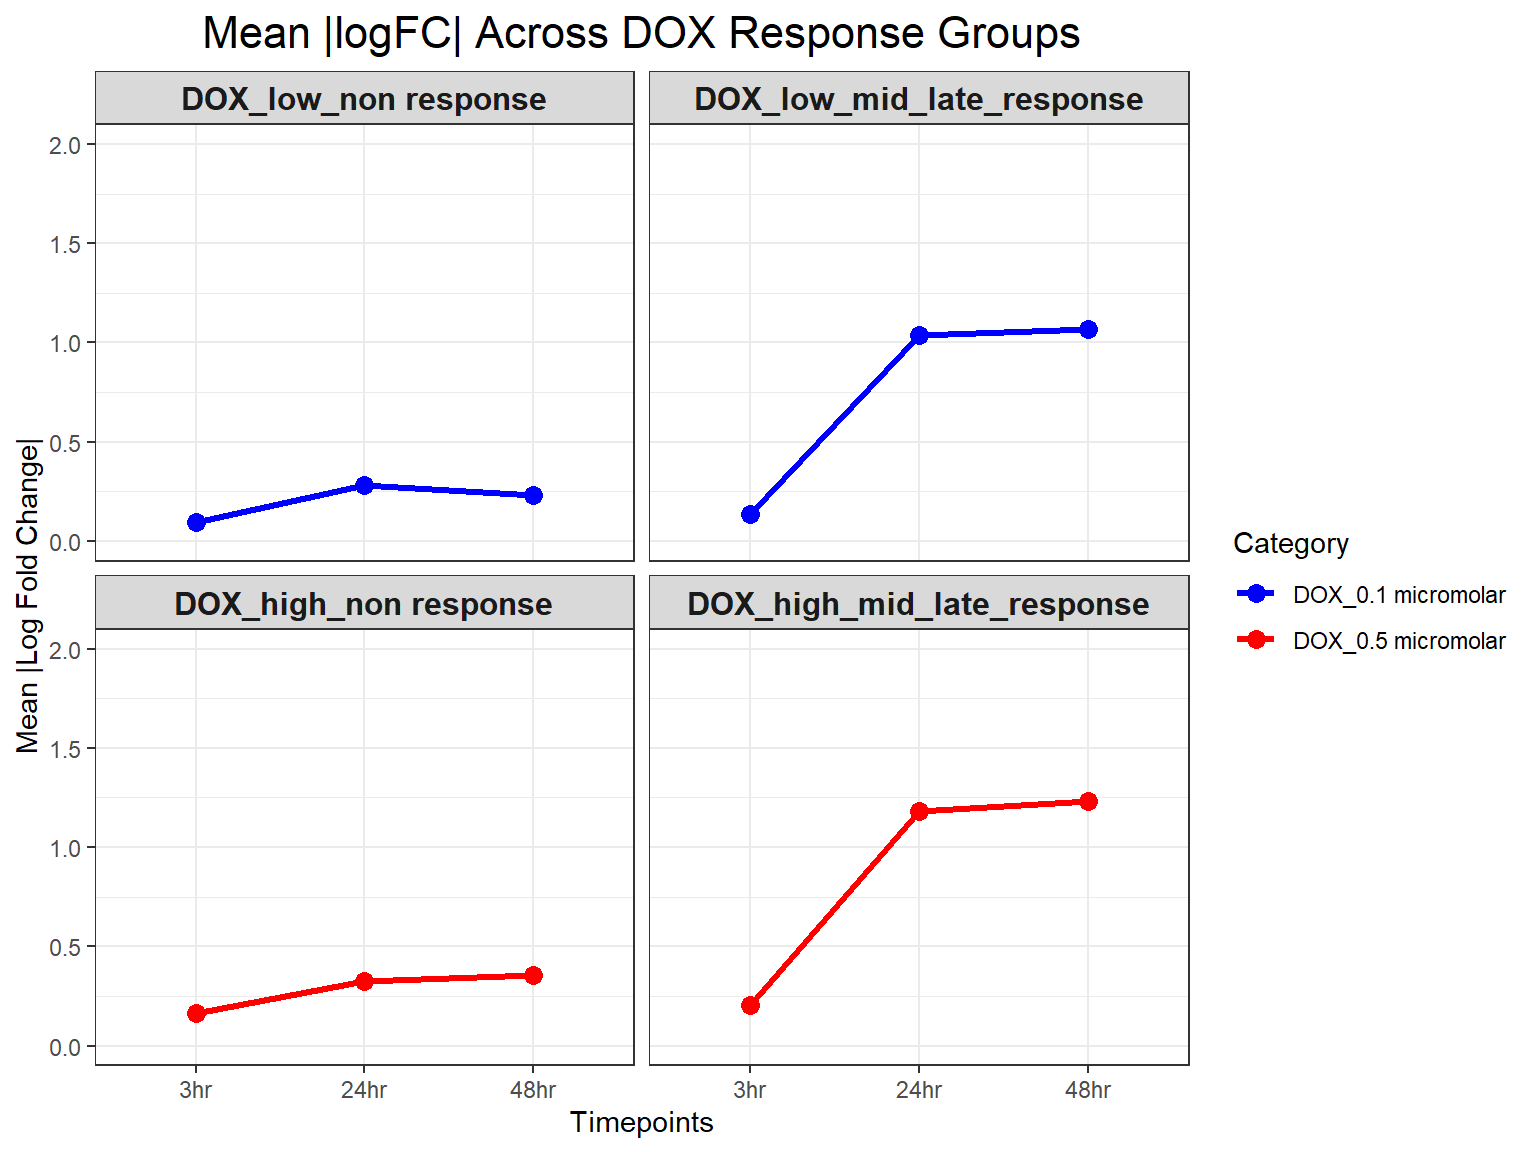
| Version | Author | Date |
|---|---|---|
| fb09f5f | sayanpaul01 | 2025-03-03 |
📌 Mean logFC across timepoints (CX response groups)
# Load required libraries
# Load required libraries
library(dplyr)
library(ggplot2)

# Load Response Groups from CSV Files
prob_CX_1_0.1 <- as.character(read.csv("data/prob_CX_1_0.1.csv")$Entrez_ID)
prob_CX_2_0.1 <- as.character(read.csv("data/prob_CX_2_0.1.csv")$Entrez_ID)
prob_CX_1_0.5 <- as.character(read.csv("data/prob_CX_1_0.5.csv")$Entrez_ID)
prob_CX_2_0.5 <- as.character(read.csv("data/prob_CX_2_0.5.csv")$Entrez_ID)

# Load Datasets (CX 0.1 & CX 0.5 Micromolar)
CX_0.1_3  <- read.csv("data/DEGs/Toptable_CX_0.1_3.csv")
CX_0.1_24 <- read.csv("data/DEGs/Toptable_CX_0.1_24.csv")
CX_0.1_48 <- read.csv("data/DEGs/Toptable_CX_0.1_48.csv")

CX_0.5_3  <- read.csv("data/DEGs/Toptable_CX_0.5_3.csv")
CX_0.5_24 <- read.csv("data/DEGs/Toptable_CX_0.5_24.csv")
CX_0.5_48 <- read.csv("data/DEGs/Toptable_CX_0.5_48.csv")

# Combine Data for CX 0.1 micromolar
CX_toptables_0.1 <- bind_rows(
  CX_0.1_3  %>% mutate(Timepoint = "3hr", Concentration = "CX_0.1 micromolar"),
  CX_0.1_24 %>% mutate(Timepoint = "24hr", Concentration = "CX_0.1 micromolar"),
  CX_0.1_48 %>% mutate(Timepoint = "48hr", Concentration = "CX_0.1 micromolar")
)

# Combine Data for CX 0.5 micromolar
CX_toptables_0.5 <- bind_rows(
  CX_0.5_3  %>% mutate(Timepoint = "3hr", Concentration = "CX_0.5 micromolar"),
  CX_0.5_24 %>% mutate(Timepoint = "24hr", Concentration = "CX_0.5 micromolar"),
  CX_0.5_48 %>% mutate(Timepoint = "48hr", Concentration = "CX_0.5 micromolar")
)

# Assign Response Groups for CX 0.1
CX_toptables_0.1 <- CX_toptables_0.1 %>%
  mutate(
    Response_Group = case_when(
      Entrez_ID %in% prob_CX_1_0.1 ~ "CX_low_non response",
      Entrez_ID %in% prob_CX_2_0.1 ~ "CX_low_mid_late_response",
      TRUE ~ NA_character_
    )
  ) %>%
  filter(!is.na(Response_Group))

# Assign Response Groups for CX 0.5
CX_toptables_0.5 <- CX_toptables_0.5 %>%
  mutate(
    Response_Group = case_when(
      Entrez_ID %in% prob_CX_1_0.5 ~ "CX_high_non response",
      Entrez_ID %in% prob_CX_2_0.5 ~ "CX_high_mid_late_response",
      TRUE ~ NA_character_
    )
  ) %>%
  filter(!is.na(Response_Group))

# Merge Both Concentrations Separately (Keeping them Separate)
CX_toptables_0.1$Category <- "CX_0.1 micromolar"
CX_toptables_0.5$Category <- "CX_0.5 micromolar"

CX_toptables <- bind_rows(CX_toptables_0.1, CX_toptables_0.5)

# Convert Factors for Proper Ordering
CX_toptables$Timepoint <- factor(CX_toptables$Timepoint, levels = c("3hr", "24hr", "48hr"))
CX_toptables$Response_Group <- factor(CX_toptables$Response_Group, levels = c(
  "CX_low_non response", "CX_low_mid_late_response",
  "CX_high_non response", "CX_high_mid_late_response"
))

# Calculate Mean LogFC per Response Group, Timepoint, and Concentration
mean_logFC <- CX_toptables %>%
  group_by(Response_Group, Timepoint, Category) %>%
  summarise(mean_logFC = mean(logFC, na.rm = TRUE), .groups = "drop")

# **Plot Mean LogFC Line Plot (Y-limit: -2 to 2)**
ggplot(mean_logFC, aes(x = Timepoint, y = mean_logFC, color = Category, group = Category)) +
  geom_line(size = 1.2) +
  geom_point(size = 3) +
  facet_wrap(~ Response_Group, ncol = 2) +  # Two columns, ensuring a 2x2 grid
  theme_bw() +
  labs(
    x = "Timepoints",
    y = "Mean logFC",
    title = "Mean logFC across CX response groups"
  ) +
  theme(
    plot.title = element_text(size = rel(1.5), hjust = 0.5),
    strip.text = element_text(size = 12, face = "bold")  # Formatting facet labels
  ) +
  scale_color_manual(values = c("CX_0.1 micromolar" = "blue", "CX_0.5 micromolar" = "red")) +
  ylim(-2, 2)  # Set Y-axis limits from -2 to 2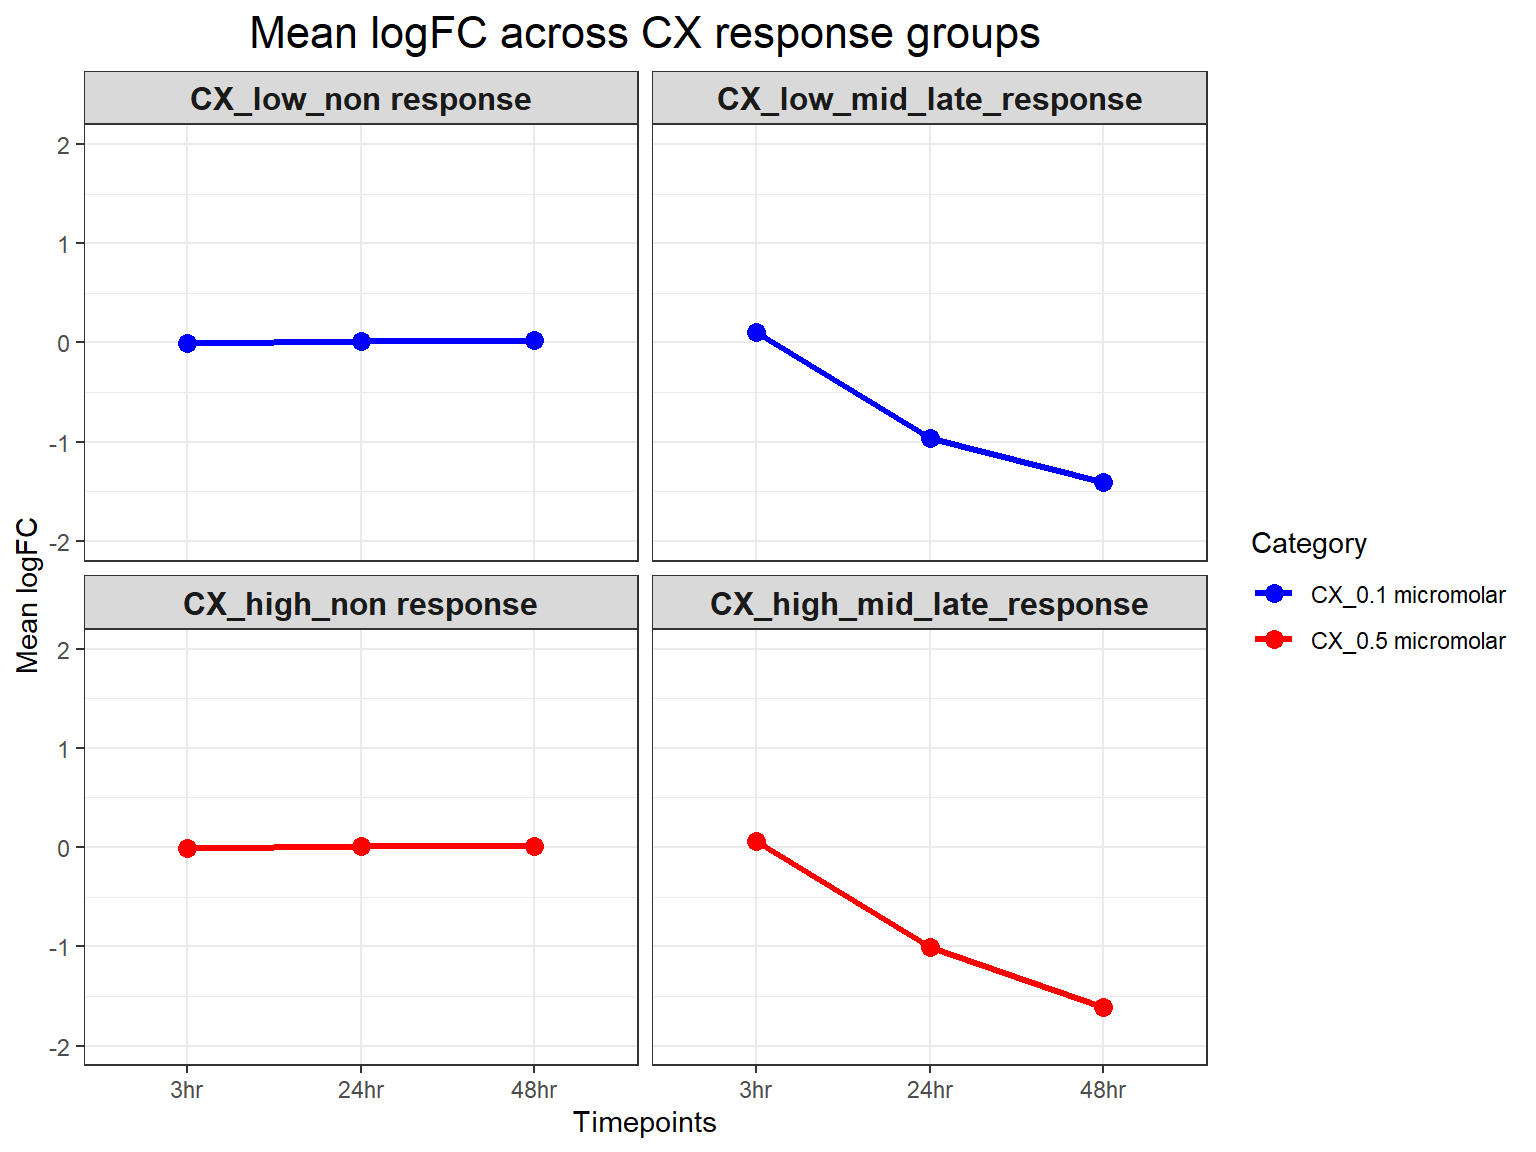
| Version | Author | Date |
|---|---|---|
| fb09f5f | sayanpaul01 | 2025-03-03 |
📌 Mean logFC across timepoints (DOX response groups)
# Load required libraries
library(dplyr)
library(ggplot2)

# Load Response Groups from CSV Files
prob_DOX_1_0.1 <- as.character(read.csv("data/prob_DOX_1_0.1.csv")$Entrez_ID)
prob_DOX_2_0.1 <- as.character(read.csv("data/prob_DOX_2_0.1.csv")$Entrez_ID)
prob_DOX_1_0.5 <- as.character(read.csv("data/prob_DOX_1_0.5.csv")$Entrez_ID)
prob_DOX_2_0.5 <- as.character(read.csv("data/prob_DOX_2_0.5.csv")$Entrez_ID)

# Load Datasets (DOX 0.1 & DOX 0.5 Micromolar)
DOX_0.1_3  <- read.csv("data/DEGs/Toptable_DOX_0.1_3.csv")
DOX_0.1_24 <- read.csv("data/DEGs/Toptable_DOX_0.1_24.csv")
DOX_0.1_48 <- read.csv("data/DEGs/Toptable_DOX_0.1_48.csv")

DOX_0.5_3  <- read.csv("data/DEGs/Toptable_DOX_0.5_3.csv")
DOX_0.5_24 <- read.csv("data/DEGs/Toptable_DOX_0.5_24.csv")
DOX_0.5_48 <- read.csv("data/DEGs/Toptable_DOX_0.5_48.csv")

# Combine Data for DOX 0.1 micromolar
DOX_toptables_0.1 <- bind_rows(
  DOX_0.1_3  %>% mutate(Timepoint = "3hr", Concentration = "DOX_0.1 micromolar"),
  DOX_0.1_24 %>% mutate(Timepoint = "24hr", Concentration = "DOX_0.1 micromolar"),
  DOX_0.1_48 %>% mutate(Timepoint = "48hr", Concentration = "DOX_0.1 micromolar")
)

# Combine Data for DOX 0.5 micromolar
DOX_toptables_0.5 <- bind_rows(
  DOX_0.5_3  %>% mutate(Timepoint = "3hr", Concentration = "DOX_0.5 micromolar"),
  DOX_0.5_24 %>% mutate(Timepoint = "24hr", Concentration = "DOX_0.5 micromolar"),
  DOX_0.5_48 %>% mutate(Timepoint = "48hr", Concentration = "DOX_0.5 micromolar")
)

# Assign Response Groups for DOX 0.1
DOX_toptables_0.1 <- DOX_toptables_0.1 %>%
  mutate(
    Response_Group = case_when(
      Entrez_ID %in% prob_DOX_1_0.1 ~ "DOX_low_non response",
      Entrez_ID %in% prob_DOX_2_0.1 ~ "DOX_low_mid_late_response",
      TRUE ~ NA_character_
    )
  ) %>%
  filter(!is.na(Response_Group))

# Assign Response Groups for DOX 0.5
DOX_toptables_0.5 <- DOX_toptables_0.5 %>%
  mutate(
    Response_Group = case_when(
      Entrez_ID %in% prob_DOX_1_0.5 ~ "DOX_high_non response",
      Entrez_ID %in% prob_DOX_2_0.5 ~ "DOX_high_mid_late_response",
      TRUE ~ NA_character_
    )
  ) %>%
  filter(!is.na(Response_Group))

# Merge Both Concentrations (Keeping them Separate)
DOX_toptables_0.1$Category <- "DOX_0.1 micromolar"
DOX_toptables_0.5$Category <- "DOX_0.5 micromolar"

DOX_toptables <- bind_rows(DOX_toptables_0.1, DOX_toptables_0.5)

# Convert Factors for Proper Ordering
DOX_toptables$Timepoint <- factor(DOX_toptables$Timepoint, levels = c("3hr", "24hr", "48hr"))
DOX_toptables$Response_Group <- factor(DOX_toptables$Response_Group, levels = c(
  "DOX_low_non response", "DOX_low_mid_late_response",
  "DOX_high_non response", "DOX_high_mid_late_response"
))

# Calculate Mean LogFC per Response Group, Timepoint, and Concentration
mean_logFC <- DOX_toptables %>%
  group_by(Response_Group, Timepoint, Category) %>%
  summarise(mean_logFC = mean(logFC, na.rm = TRUE), .groups = "drop")

# **Plot Mean LogFC Line Plot (Y-limit: -2 to 2)**
ggplot(mean_logFC, aes(x = Timepoint, y = mean_logFC, color = Category, group = Category)) +
  geom_line(size = 1.2) +
  geom_point(size = 3) +
  facet_wrap(~ Response_Group, ncol = 2) +  # Two columns, ensuring a 2x2 grid
  theme_bw() +
  labs(
    x = "Timepoints",
    y = "Mean logFC",
    title = "Mean logFC across DOX response groups"
  ) +
  theme(
    plot.title = element_text(size = rel(1.5), hjust = 0.5),
    strip.text = element_text(size = 12, face = "bold")  # Formatting facet labels
  ) +
  scale_color_manual(values = c("DOX_0.1 micromolar" = "blue", "DOX_0.5 micromolar" = "red")) +
  ylim(-2, 2)  # Set Y-axis limits from -2 to 2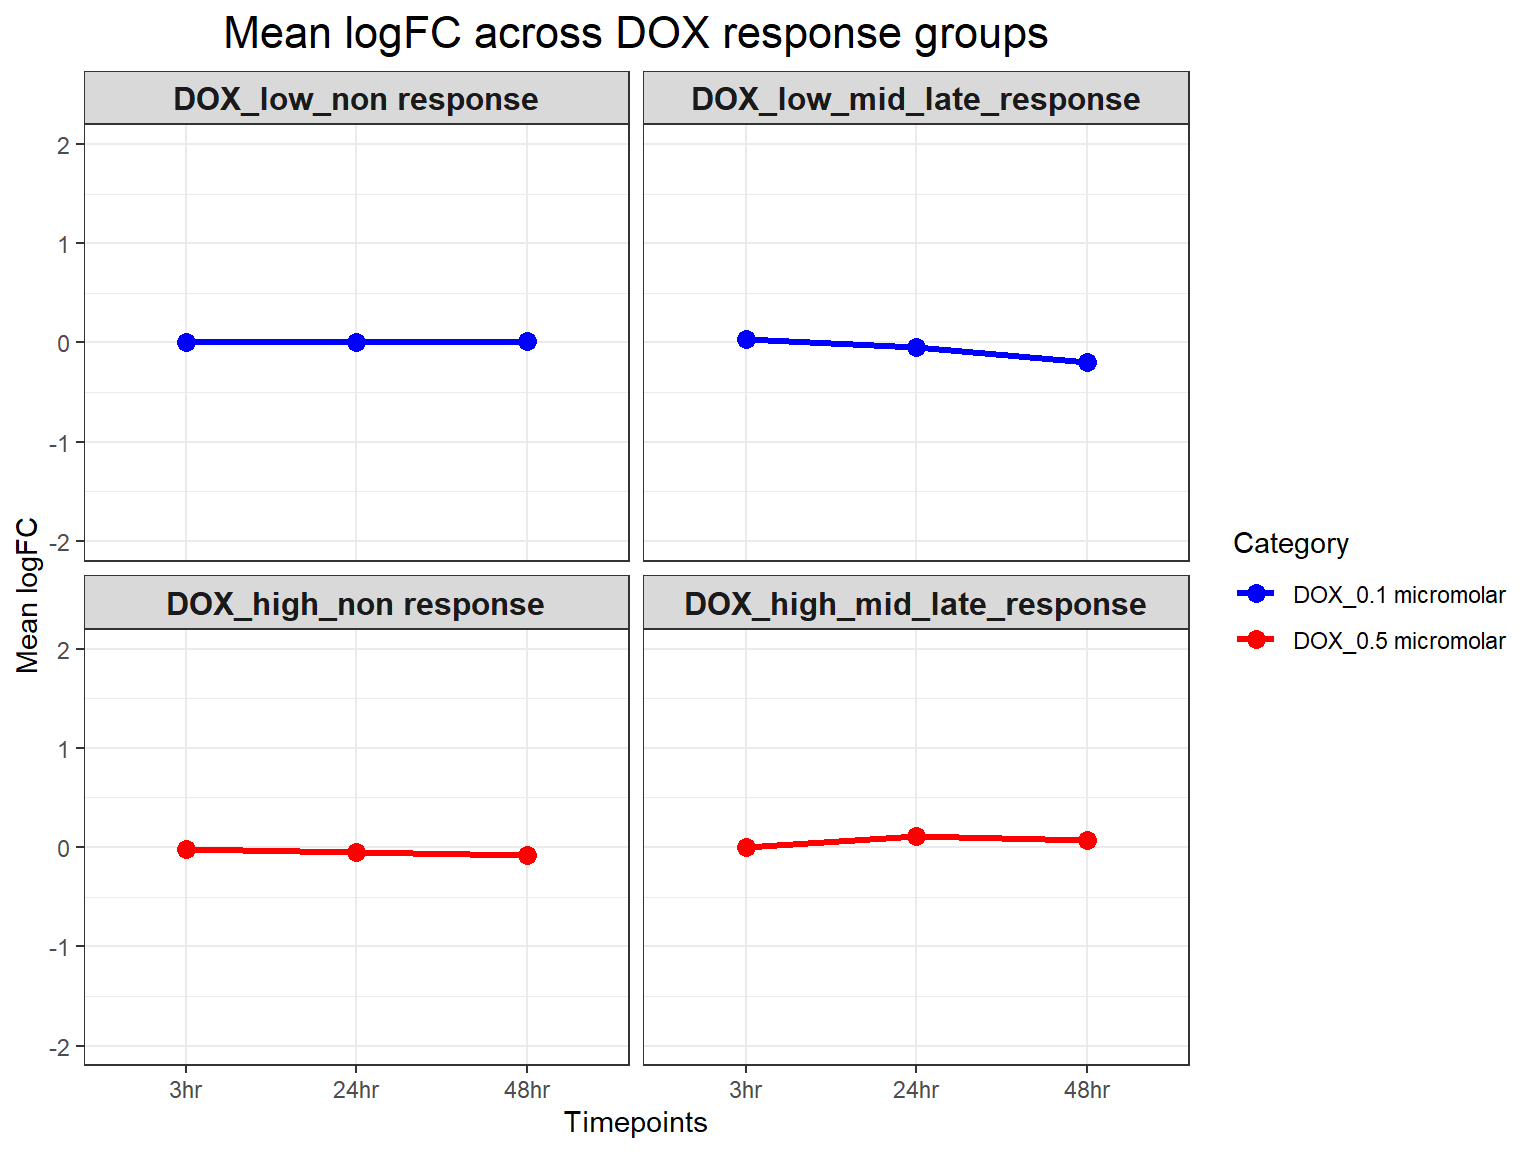
| Version | Author | Date |
|---|---|---|
| fb09f5f | sayanpaul01 | 2025-03-03 |
sessionInfo()R version 4.3.0 (2023-04-21 ucrt)
Platform: x86_64-w64-mingw32/x64 (64-bit)
Running under: Windows 11 x64 (build 22631)
Matrix products: default
locale:
[1] LC_COLLATE=English_United States.utf8
[2] LC_CTYPE=English_United States.utf8
[3] LC_MONETARY=English_United States.utf8
[4] LC_NUMERIC=C
[5] LC_TIME=English_United States.utf8
time zone: America/Chicago
tzcode source: internal
attached base packages:
[1] stats graphics grDevices utils datasets methods base
other attached packages:
[1] ggplot2_3.5.1 gprofiler2_0.2.3 BiocParallel_1.36.0
[4] dplyr_1.1.4 Rfast_2.1.0 RcppParallel_5.1.9
[7] RcppZiggurat_0.1.6 Rcpp_1.0.12 Cormotif_1.48.0
[10] limma_3.58.1 affy_1.80.0 Biobase_2.62.0
[13] BiocGenerics_0.48.1 workflowr_1.7.1
loaded via a namespace (and not attached):
[1] gtable_0.3.6 xfun_0.50 bslib_0.8.0
[4] htmlwidgets_1.6.4 processx_3.8.5 callr_3.7.6
[7] vctrs_0.6.5 tools_4.3.0 ps_1.8.1
[10] generics_0.1.3 parallel_4.3.0 tibble_3.2.1
[13] pkgconfig_2.0.3 data.table_1.14.10 lifecycle_1.0.4
[16] farver_2.1.2 compiler_4.3.0 stringr_1.5.1
[19] git2r_0.35.0 statmod_1.5.0 munsell_0.5.1
[22] getPass_0.2-4 codetools_0.2-20 httpuv_1.6.15
[25] htmltools_0.5.8.1 sass_0.4.9 yaml_2.3.10
[28] lazyeval_0.2.2 preprocessCore_1.64.0 plotly_4.10.4
[31] tidyr_1.3.1 later_1.3.2 pillar_1.10.1
[34] jquerylib_0.1.4 whisker_0.4.1 cachem_1.0.8
[37] tidyselect_1.2.1 digest_0.6.34 stringi_1.8.3
[40] purrr_1.0.2 labeling_0.4.3 rprojroot_2.0.4
[43] fastmap_1.1.1 grid_4.3.0 colorspace_2.1-0
[46] cli_3.6.1 magrittr_2.0.3 withr_3.0.2
[49] scales_1.3.0 promises_1.3.0 rmarkdown_2.29
[52] httr_1.4.7 affyio_1.72.0 evaluate_1.0.3
[55] knitr_1.49 viridisLite_0.4.2 rlang_1.1.3
[58] glue_1.7.0 BiocManager_1.30.25 rstudioapi_0.17.1
[61] jsonlite_1.8.9 R6_2.5.1 fs_1.6.3
[64] zlibbioc_1.48.0